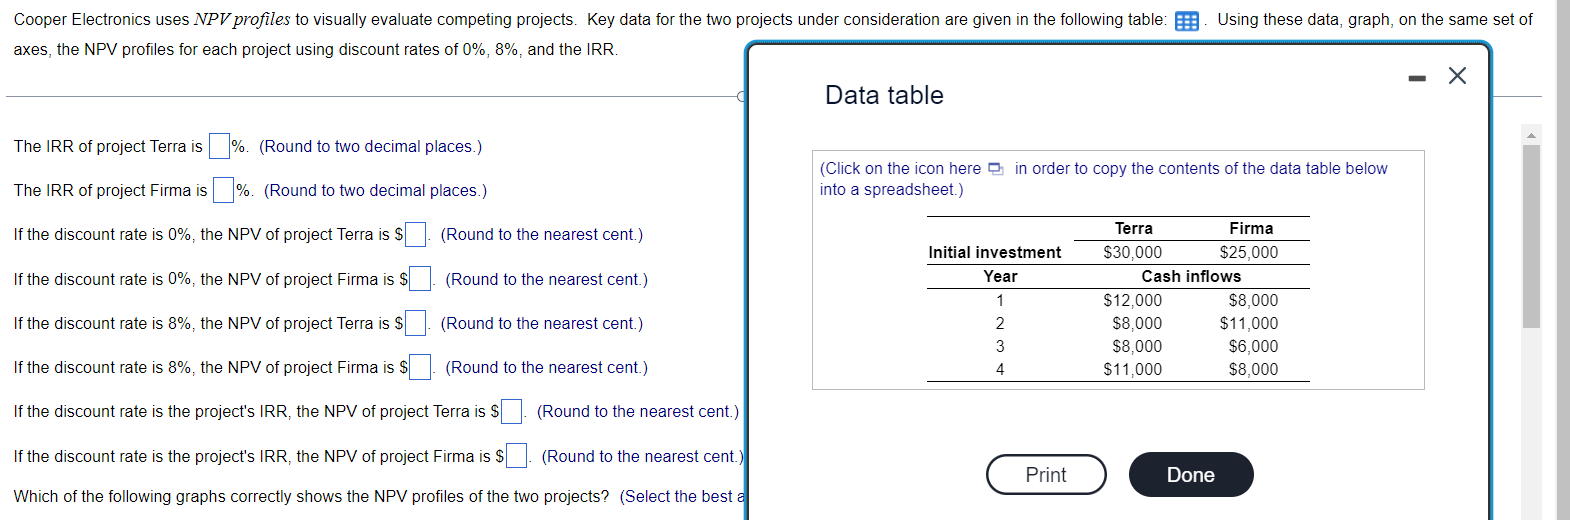
Question: Cooper Electronics uses NPV profiles to visually evaluate competing projects. Key data for the two projects under consideration are given in the following table: .

Cooper Electronics uses NPV profiles to visually
Cooper Electronics uses NPV profiles to visually evaluate competing projects. Key data for the two projects under consideration are given in the following table: . Using these data, graph, on the same set of axes, the NPV profiles for each project using discount rates of 0%, 8%, and the IRR. X Data table The IRR of project Terra is %. (Round to two decimal places.) (Click on the icon here in order to copy the contents of the data table below The IRR of project Firma is %. (Round to two decimal places.) into a spreadsheet.) If the discount rate is 0%, the NPV of project Terra is $ . (Round to the nearest cent.) Terra Firma Initial investment $30,000 $25,000 If the discount rate is 0%, the NPV of project Firma is $ . (Round to the nearest cent.) Year Cash inflows $12,000 $8,000 If the discount rate is 8%, the NPV of project Terra is $ . (Round to the nearest cent.) $8,000 $11,000 AWN- $8,000 $6,000 If the discount rate is 8%, the NPV of project Firma is $ . (Round to the nearest cent.) $11,000 $8,000 If the discount rate is the project's IRR, the NPV of project Terra is $ . (Round to the nearest cent.) If the discount rate is the project's IRR, the NPV of project Firma is $ . (Round to the nearest cent.) Print Done Which of the following graphs correctly shows the NPV profiles of the two projects? (Select the best a

Step by Step Solution

There are 3 Steps involved in it

1 Expert Approved Answer
Step: 1 Unlock blur-text-image
Question Has Been Solved by an Expert!

Get step-by-step solutions from verified subject matter experts

Step: 2 Unlock
Step: 3 Unlock

Students Have Also Explored These Related Accounting Questions!