

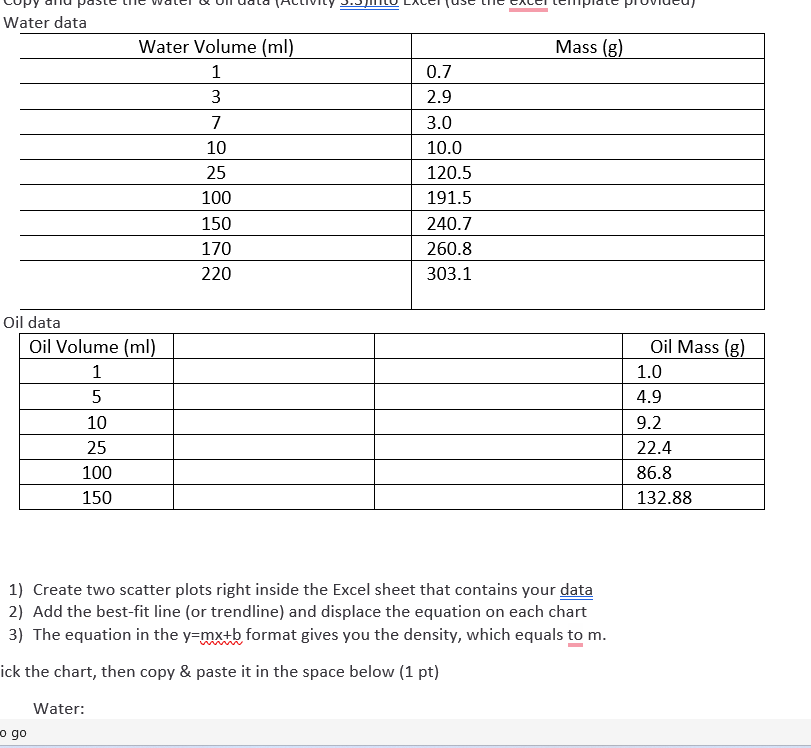
Question: Copy and paste the water & oil data ( Activity 3 . 3 ) into Excel ( use the excel template provided ) Water data
Copy and paste the water & oil data Activity into Excel use the excel template provided
Water data
Water Volume ml Mass g
Oil data
Oil Volume ml Oil Mass g
Create two scatter plots right inside the Excel sheet that contains your data
Add the bestfit line or trendline and displace the equation on each chart
The equation in the ymxb format gives you the density, which equals to m
Click the chart, then copy & paste it in the space below pt
Water:
Oil:
Graph grading rubric
Informative title pt
Proper axis label pts
o Each axis should be labeled with the variable name and unit if the variable measurement has unit
o Independent variable plotted on the xaxis; dependent variable plotted on the yaxis
Presence of the bestfit line & equation pt
Use the equations to determine the density record your answers to two decimal places; include unit pt
Water density
Oil density
Use the specific density data from above to answer the question: Why does the oil float on the surface of the water? ptWater data
Oil data
Create two scatter plots right inside the Excel sheet that contains your data
Add the bestfit line or trendline and displace the equation on each chart
The equation in the format gives you the density, which equals to
ick the chart, then copy & paste it in the space below pt
Water:
Step by Step Solution
There are 3 Steps involved in it
1 Expert Approved Answer
Step: 1 Unlock

Question Has Been Solved by an Expert!
Get step-by-step solutions from verified subject matter experts
Step: 2 Unlock
Step: 3 Unlock