

Question: correct code in matlab and will give thumbs up An engineering firm contacted you to develop software to aid in the visualization of the convolution
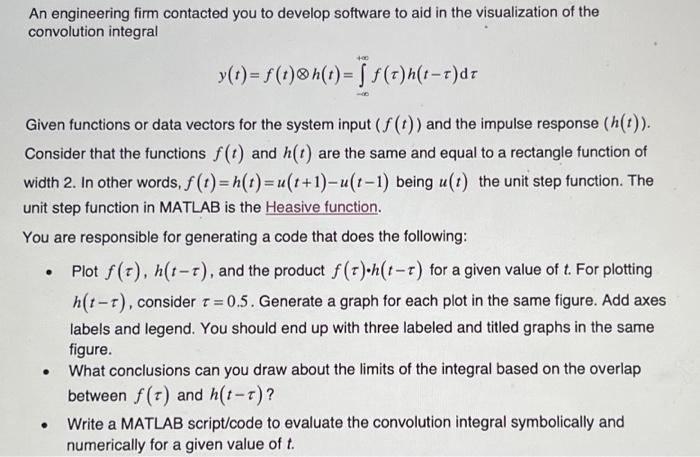
An engineering firm contacted you to develop software to aid in the visualization of the convolution integral y(t)=f(t)h(t)=+f()h(t)d Given functions or data vectors for the system input (f(t)) and the impulse response (h(t)). Consider that the functions f(t) and h(t) are the same and equal to a rectangle function of width 2. In other words, f(t)=h(t)=u(t+1)u(t1) being u(t) the unit step function. The unit step function in MATLAB is the Heasive function. You are responsible for generating a code that does the following: - Plot f(),h(t), and the product f()h(t) for a given value of t. For plotting h(t), consider =0.5. Generate a graph for each plot in the same figure. Add axes labels and legend. You should end up with three labeled and titled graphs in the same figure. - What conclusions can you draw about the limits of the integral based on the overlap between f() and h(t) ? - Write a MATLAB script/code to evaluate the convolution integral symbolically and numerically for a given value of t
Step by Step Solution
There are 3 Steps involved in it

Get step-by-step solutions from verified subject matter experts