

Question: Do in MatLab please You were contacted by an engineering firm to develop software to aid in the visualization of the convolution integral y(t) =
Do in MatLab please
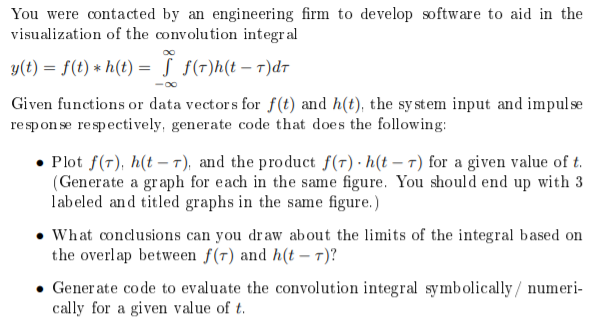
You were contacted by an engineering firm to develop software to aid in the visualization of the convolution integral y(t) = f(t) * h(t) = f(r)h(t-r)dr Given functions or data vectors for f(t) and h(t), the sy stem input and impulse -00 response respectively, generate code that does the following: Plot f(T) h(t) and the product f() h(t T) for a given value of t. (Generate a graph for each in the same figure. You should end up with 3 labeled and titled graphs in the same figure.) What conclusions can you draw about the limits of the integral based on the overlap between f(r) and h(t T)? Generate code to evaluate the convolution integral symbolically numeri- cally for a given value of t. You were contacted by an engineering firm to develop software to aid in the visualization of the convolution integral y(t) = f(t) * h(t) = f(r)h(t-r)dr Given functions or data vectors for f(t) and h(t), the sy stem input and impulse -00 response respectively, generate code that does the following: Plot f(T) h(t) and the product f() h(t T) for a given value of t. (Generate a graph for each in the same figure. You should end up with 3 labeled and titled graphs in the same figure.) What conclusions can you draw about the limits of the integral based on the overlap between f(r) and h(t T)? Generate code to evaluate the convolution integral symbolically numeri- cally for a given value of t
Step by Step Solution
There are 3 Steps involved in it

Get step-by-step solutions from verified subject matter experts