

Question: Correctly state, set up apply appropriate equation(s)/formula(s). correctly arrive at an answer using proper mathematical (algebra) rule (+/- sign must be correct). The response must
Correctly state, set up apply appropriate equation(s)/formula(s). correctly arrive at an answer using proper mathematical (algebra) rule (+/- sign must be correct). The response must be in the appropriate format and at a minimum contain four significant figures
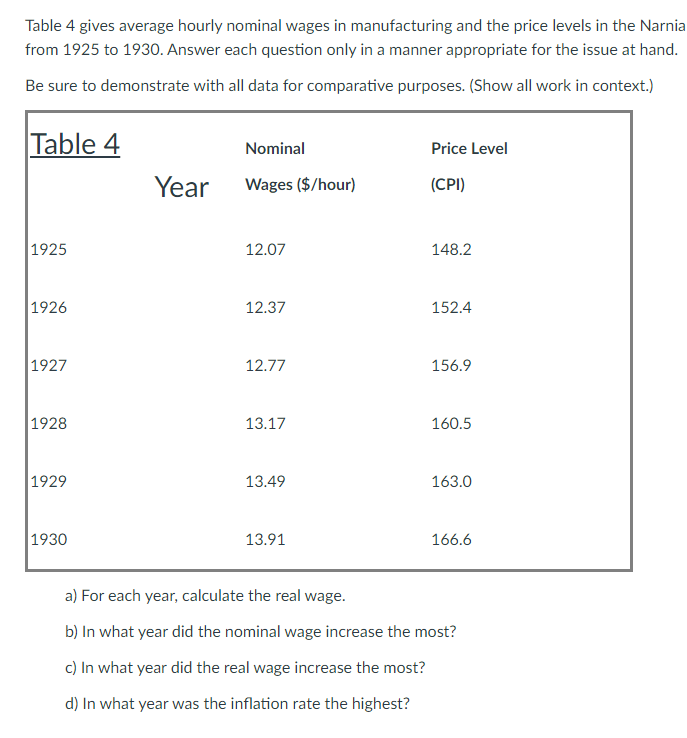
Table 4 gives average hourly nominal wages in manufacturing and the price levels in the Narnia from 1925 to 1930. Answer each question only in a manner appropriate for the issue at hand. Be sure to demonstrate with all data for comparative purposes. (Show all work in context.) Table 4 Nominal Price Level Year Wages ($/hour) (CPI) 1925 12.07 148.2 1926 12.37 152.4 1927 12.77 156.9 1928 13.17 160.5 1929 13.49 163.0 1930 13.91 166.6 a) For each year, calculate the real wage. b) In what year did the nominal wage increase the most? c) In what year did the real wage increase the most? d) In what year was the inflation rate the highest
Step by Step Solution
There are 3 Steps involved in it

Get step-by-step solutions from verified subject matter experts