

Question: Correlation Analysis: Health State Dataset Variables The CORR Procedure 5 Variables: Not Healthy Obesity High School Smoking Insurance Simple Linear Regression: Not Healthy - Smoking
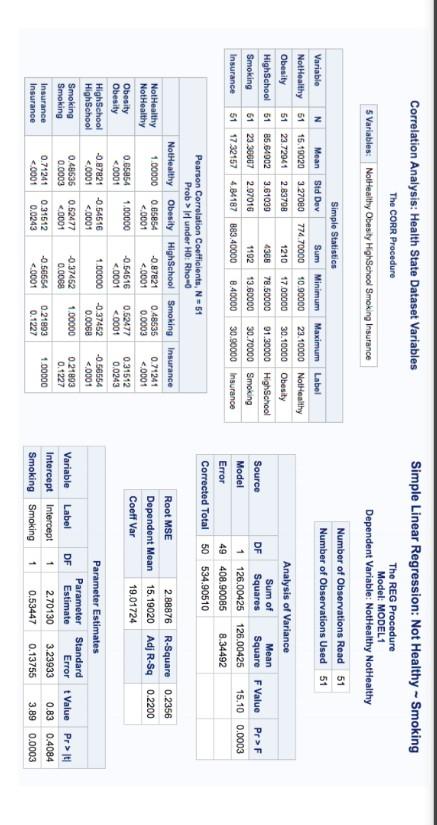
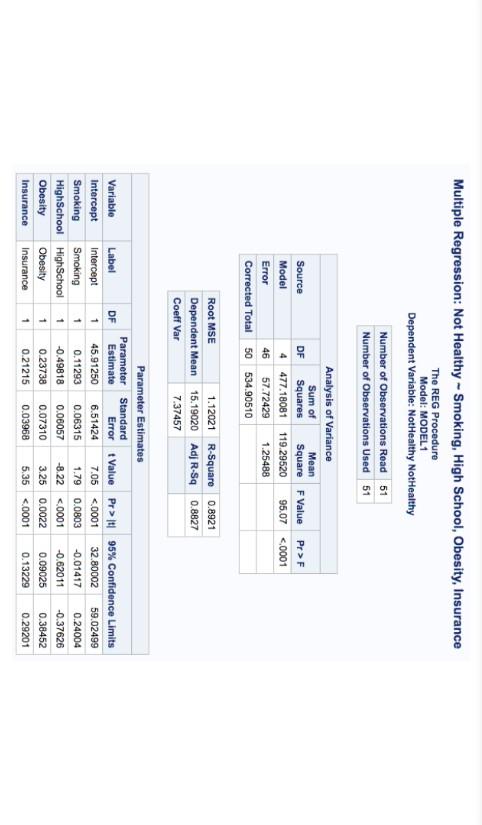
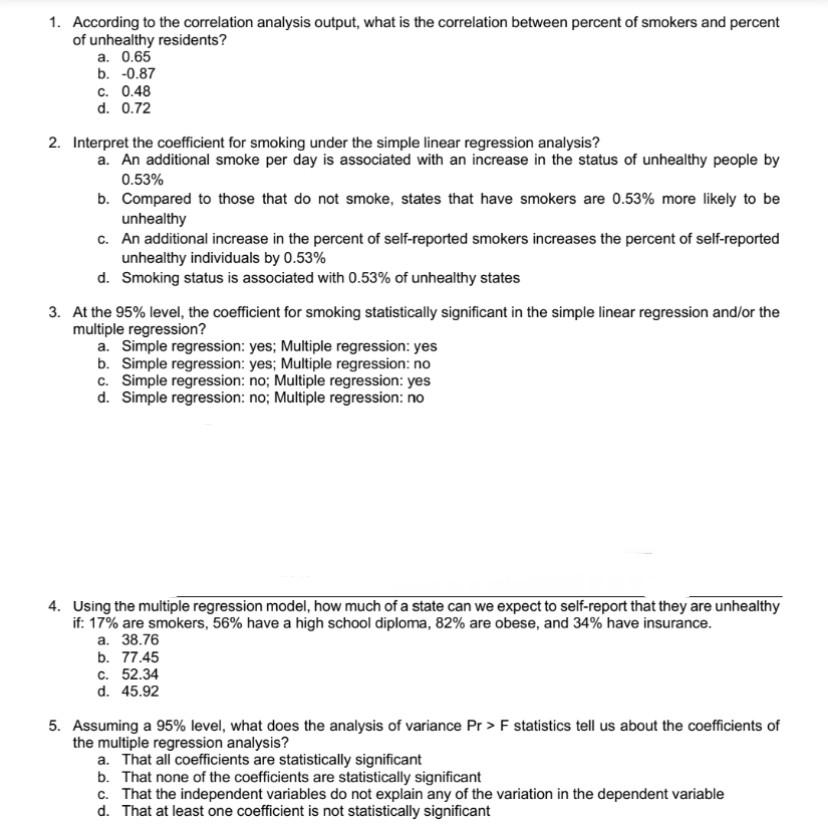
Correlation Analysis: Health State Dataset Variables The CORR Procedure 5 Variables: Not Healthy Obesity High School Smoking Insurance Simple Linear Regression: Not Healthy - Smoking The REG Procedure Model: MODEL 1 Dependent Variable: NotHealthy NotHealthy Number of Observations Read 51 Number of Observations Used 51 Simple Statistics Variable N Mean Std Dev Sum Minimum Maximum Label Not Healthy 61 15,49020 3.27080 774.70000 10.90000 23.10000 Not Healthy Obesity 51 23.72041 2.83708 1210 17.00000 30.10000 Obesity High School 51 86.84002 3.81039 4368 78.50000 01.30000 High School Smoking 61 23.30807 2.07010 1192 13.60000 30.70000 Smoking Insurance 51 17.32157 434187 883.40000 40000 30.90000 Insurance Analysis of Variance Sum of Mean Source DF Squares Square FValue Pr>F Mode! 1 126.00425 126.00425 15.10 0.0003 Error 49 408.90085 8.34492 Corrected Total 50 534.90510 Root MSE 2.88876 R-Square 0.2356 Dependent Moan 15.19020 Adj R-Sq 0.2200 Coeff Var 19.01724 Not Healthy NotHealthy Obesity Obesity High School High School Smoking Smoking Insurance Insurance Pearson Correlation coefficients, N=51 Prob>If under HO: Rho NotHealthy Obesity High School Smoking Insurance 1.00000 0.65854 -0.87821 0.48535 0.71241 <.0001 variable label intercept smoking parameter estimates standard df estimate error value pr>t 1 2.70130 3.23933 0.83 0.4084 1 0.53447 0.13755 3.89 0.0003 Multiple Regression: Not Healthy - Smoking, High School, Obesity, Insurance The REG Procedure Model: MODEL 1 Dependent Variable: Not Healthy Not Healthy Number of Observations Read 51 Number of Observations Used 51 Pr>F Source Model Error Corrected Total Analysis of Variance Sum of Mean DF Squares Square F Value 4 477.18081 119.29520 95.07 <.0001 root mse r-square dependent mean adj r-sq coeff var df variable label intercept smoking high school highschool obesity insurance parameter estimates standard estimate error value pr>|95% Confidence Limits 45.91250 6.51424 7.05 <.0001 according to the correlation analysis output what is between percent of smokers and unhealthy residents a. b. c. d. interpret coefficient for smoking under simple linear regression an additional smoke per day associated with increase in status people by compared those that do not states have are more likely be self-reported increases individuals at level statistically significant multiple regression: yes regression:yes no using model how much a state can we expect self-report they if: high school diploma obese insurance. assuming does variance pr> F statistics tell us about the coefficients of the multiple regression analysis? a. That all coefficients are statistically significant b. That none of the coefficients are statistically significant C. That the independent variables do not explain any of the variation in the dependent variable d. That at least one coefficient is not statistically significant
Step by Step Solution
There are 3 Steps involved in it
1 Expert Approved Answer
Step: 1 Unlock

Question Has Been Solved by an Expert!
Get step-by-step solutions from verified subject matter experts
Step: 2 Unlock
Step: 3 Unlock