

Question: Correlation and Regression Analyses 1. The table below shows the time in hours spent by 6 students playing playdoh and the scores of these
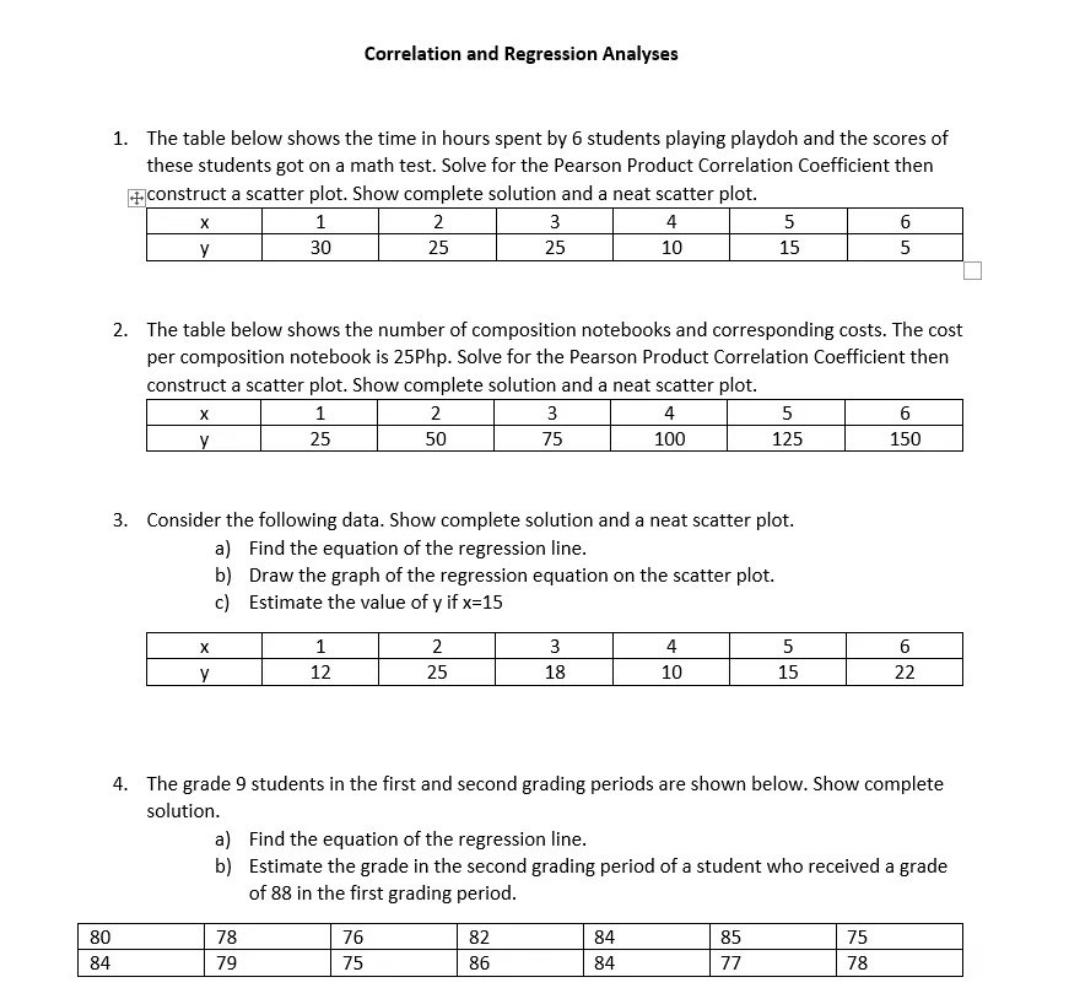
Correlation and Regression Analyses 1. The table below shows the time in hours spent by 6 students playing playdoh and the scores of these students got on a math test. Solve for the Pearson Product Correlation Coefficient then +construct a scatter plot. Show complete solution and a neat scatter plot. X y 1 30 2 25 3 25 4 10 5 6 15 5 2. The table below shows the number of composition notebooks and corresponding costs. The cost per composition notebook is 25Php. Solve for the Pearson Product Correlation Coefficient then construct a scatter plot. Show complete solution and a neat scatter plot. X y 1 25 2 3 50 75 4 100 5 6 125 150 3. Consider the following data. Show complete solution and a neat scatter plot. a) Find the equation of the regression line. b) Draw the graph of the regression equation on the scatter plot. c) Estimate the value of y if x=15 X y 1 12 2 3 4 5 6 25 18 10 15 22 4. The grade 9 students in the first and second grading periods are shown below. Show complete solution. a) Find the equation of the regression line. b) Estimate the grade in the second grading period of a student who received a grade of 88 in the first grading period. 80 78 76 82 84 85 75 84 79 75 86 84 77 78
Step by Step Solution
There are 3 Steps involved in it

Get step-by-step solutions from verified subject matter experts