

Question: cost accounting ch 10 can you help explaining how to find the numbers to plug in the graph. cost accountg chapter 10 all this picture
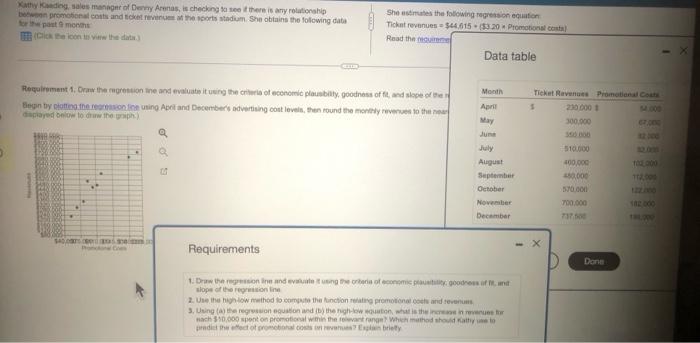
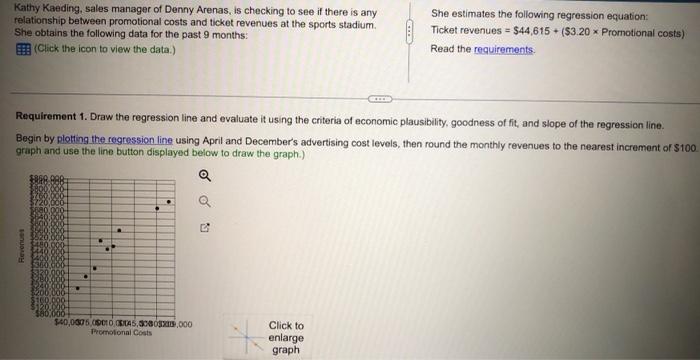
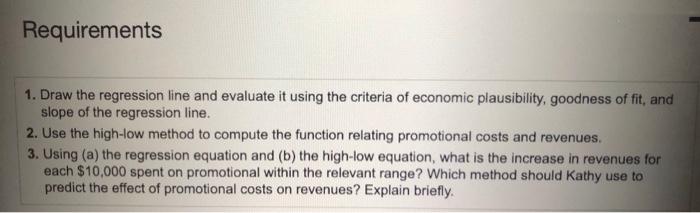
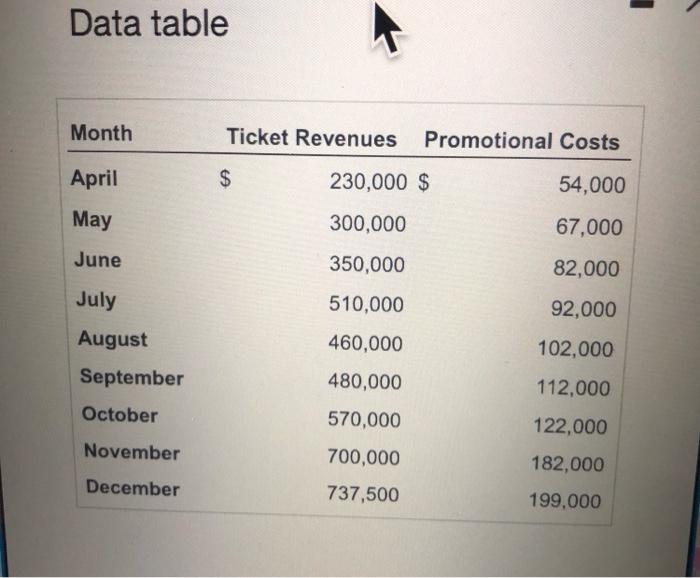
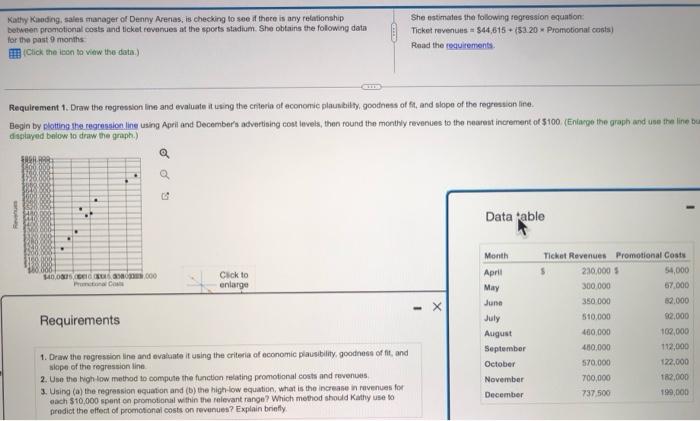
thaptajed beided to di ine the briph.) Requirements slope of the regreition Inn Kathy Kaeding, sales manager of Denny Arenas, is checking to see if there is any relationship between promotional costs and ticket revenues at the sports stadium. She obtains the following data for the past 9 months: (Click the icon to view the data.) She estimates the following regression equation: Ticket revenues =$44,615+($3.20 Promotional costs ) Read the requirements. Requirement 1. Draw the regression line and evaluate it using the criteria of economic plausibility, goodness of fit, and slope of the regression line. Begin by ploting the regression line using April and December's advertising cost levels, then round the monthly revenues to the nearest increment of $100 graph and use the line button displayed below to draw the graph.) Requirements 1. Draw the regression line and evaluate it using the criteria of economic plausibility, goodness of fit, and slope of the regression line. 2. Use the high-low method to compute the function relating promotional costs and revenues. 3. Using (a) the regression equation and (b) the high-low equation, what is the increase in revenues for each $10,000 spent on promotional within the relevant range? Which method should Kathy use to predict the effect of promotional costs on revenues? Explain briefly. Data table Regulrement 1. Draw the regression live and evaluate it using the criteria of economic plausitilty, goothests of fit, and slope of the regression life. distared beiow io draw the graph.) Requirements 1. Draw the regrestion line and ovatuate it using the criteria of economic plausibility, goodiness of fit, and sikpe of the regression line 2. Uen the kigh low method to compule the function relating promotional costs and revenues: 3. Using (a) the regreskion equation and (b) the high-iow equation, what is the increase in ravenues foe each $10,000 spent on promotional within the relevant range? Which method should Kathy use bo pendict the effert of promosonal costs on revenues? Explain briefly. thaptajed beided to di ine the briph.) Requirements slope of the regreition Inn Kathy Kaeding, sales manager of Denny Arenas, is checking to see if there is any relationship between promotional costs and ticket revenues at the sports stadium. She obtains the following data for the past 9 months: (Click the icon to view the data.) She estimates the following regression equation: Ticket revenues =$44,615+($3.20 Promotional costs ) Read the requirements. Requirement 1. Draw the regression line and evaluate it using the criteria of economic plausibility, goodness of fit, and slope of the regression line. Begin by ploting the regression line using April and December's advertising cost levels, then round the monthly revenues to the nearest increment of $100 graph and use the line button displayed below to draw the graph.) Requirements 1. Draw the regression line and evaluate it using the criteria of economic plausibility, goodness of fit, and slope of the regression line. 2. Use the high-low method to compute the function relating promotional costs and revenues. 3. Using (a) the regression equation and (b) the high-low equation, what is the increase in revenues for each $10,000 spent on promotional within the relevant range? Which method should Kathy use to predict the effect of promotional costs on revenues? Explain briefly. Data table Regulrement 1. Draw the regression live and evaluate it using the criteria of economic plausitilty, goothests of fit, and slope of the regression life. distared beiow io draw the graph.) Requirements 1. Draw the regrestion line and ovatuate it using the criteria of economic plausibility, goodiness of fit, and sikpe of the regression line 2. Uen the kigh low method to compule the function relating promotional costs and revenues: 3. Using (a) the regreskion equation and (b) the high-iow equation, what is the increase in ravenues foe each $10,000 spent on promotional within the relevant range? Which method should Kathy use bo pendict the effert of promosonal costs on revenues? Explain briefly
Step by Step Solution
There are 3 Steps involved in it

Get step-by-step solutions from verified subject matter experts