

Question: Cost Performance Report 1. This exercise requires you to complete the Earned Value Analysis for the 1st, 3rd, and 5th Reporting Periods. You must
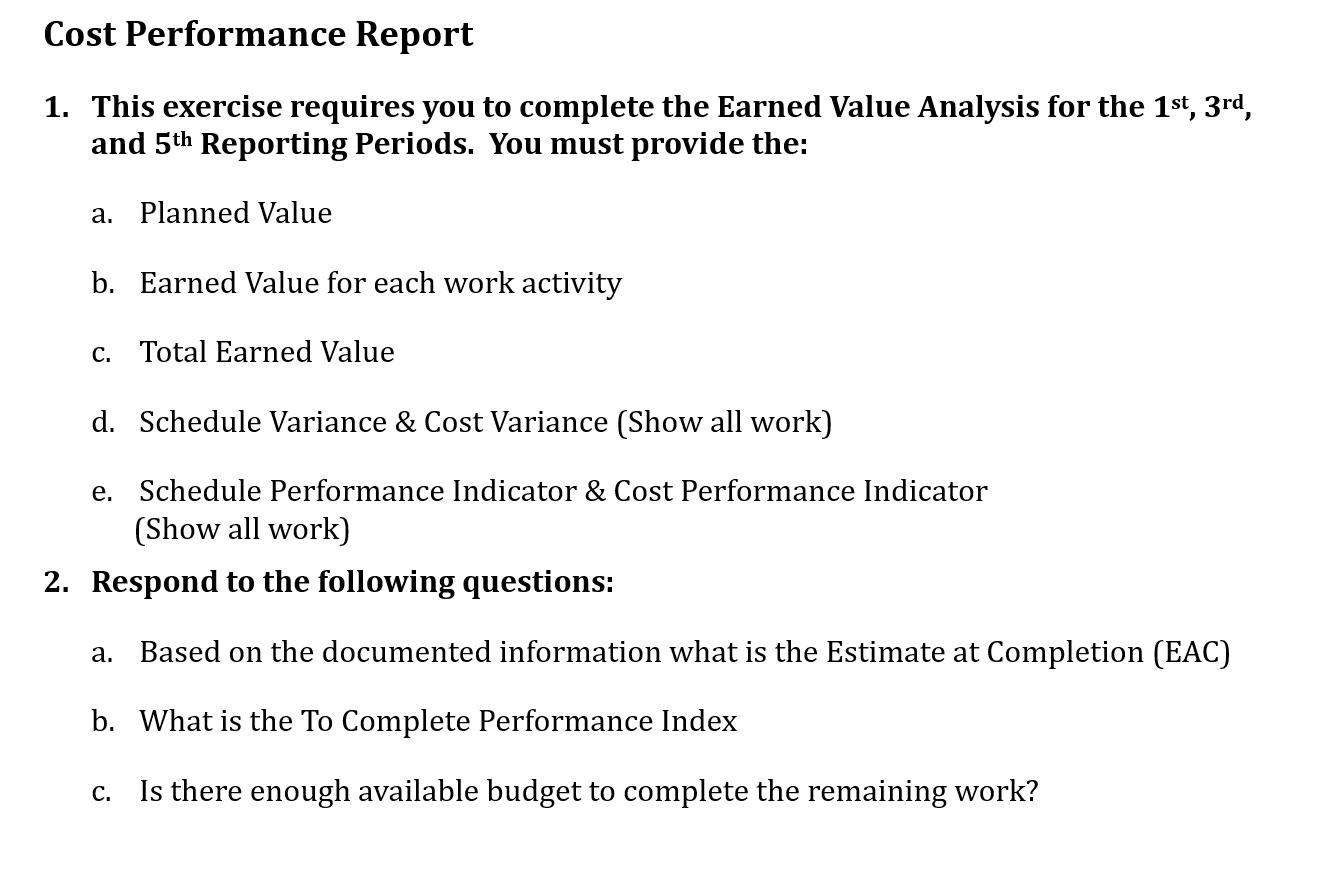
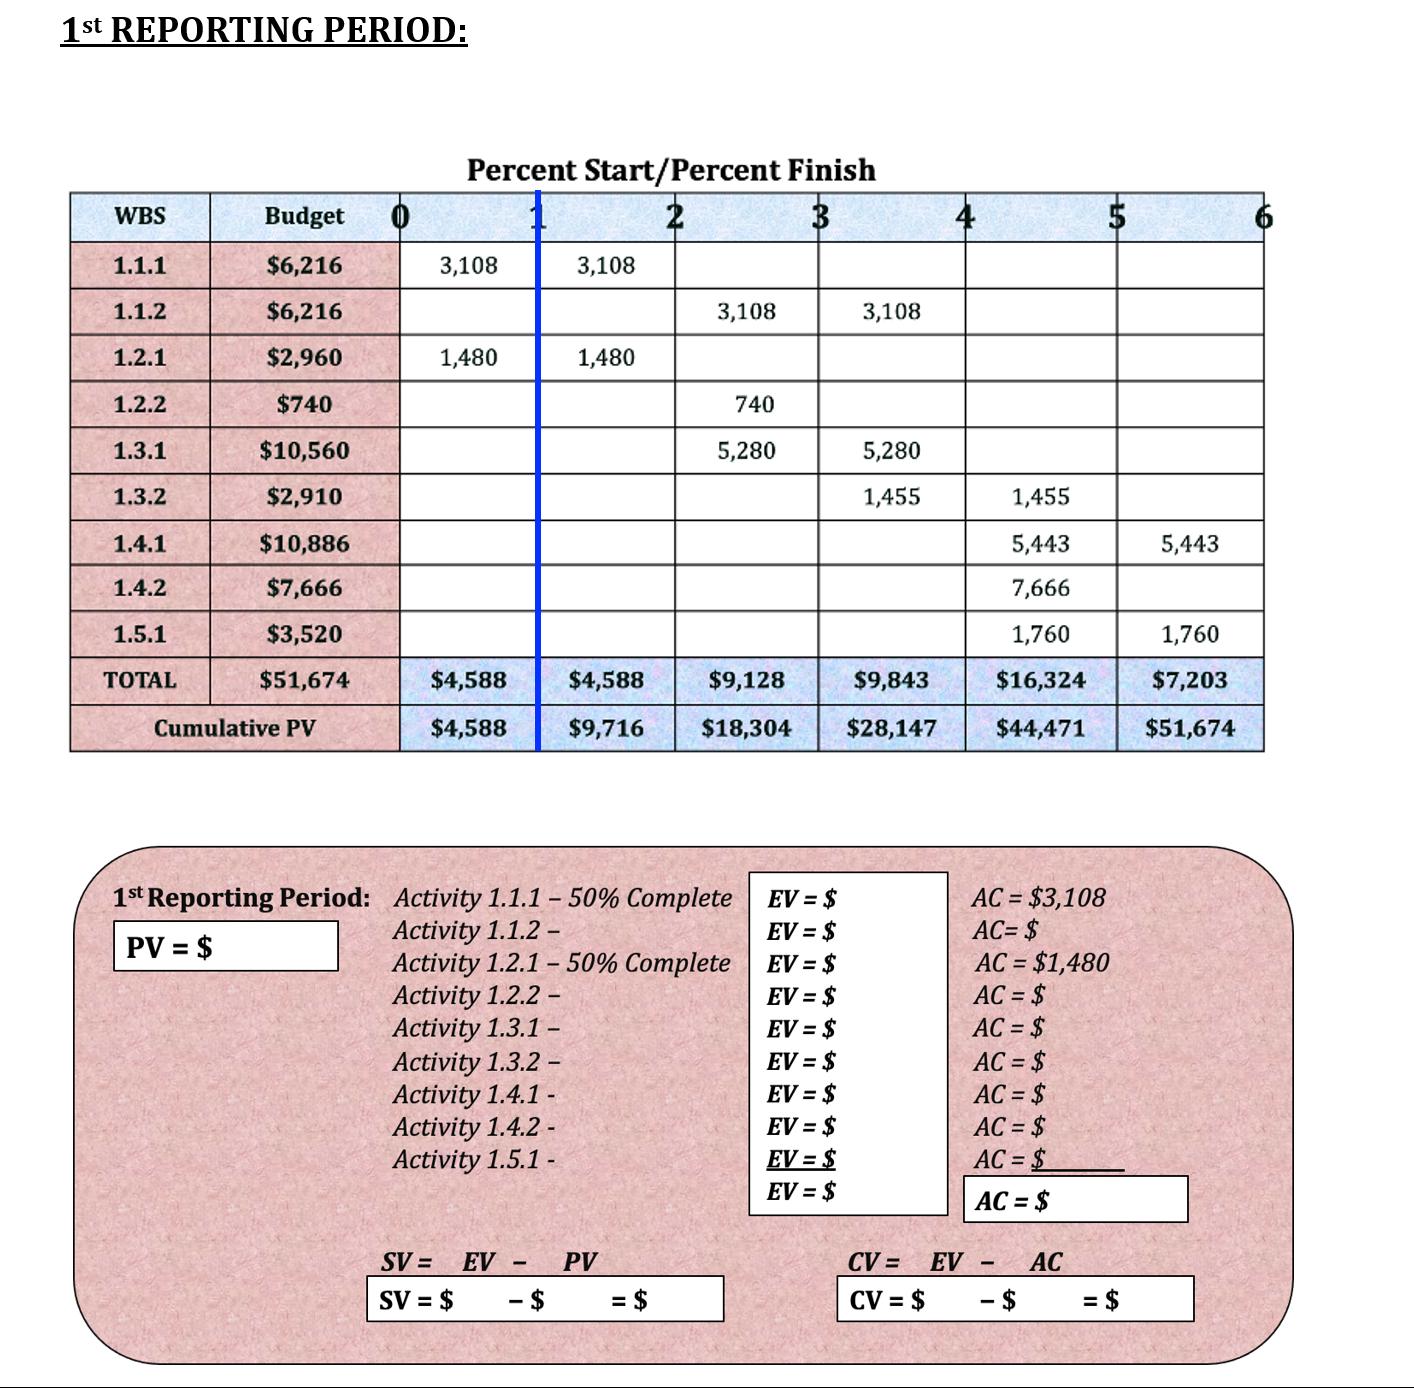
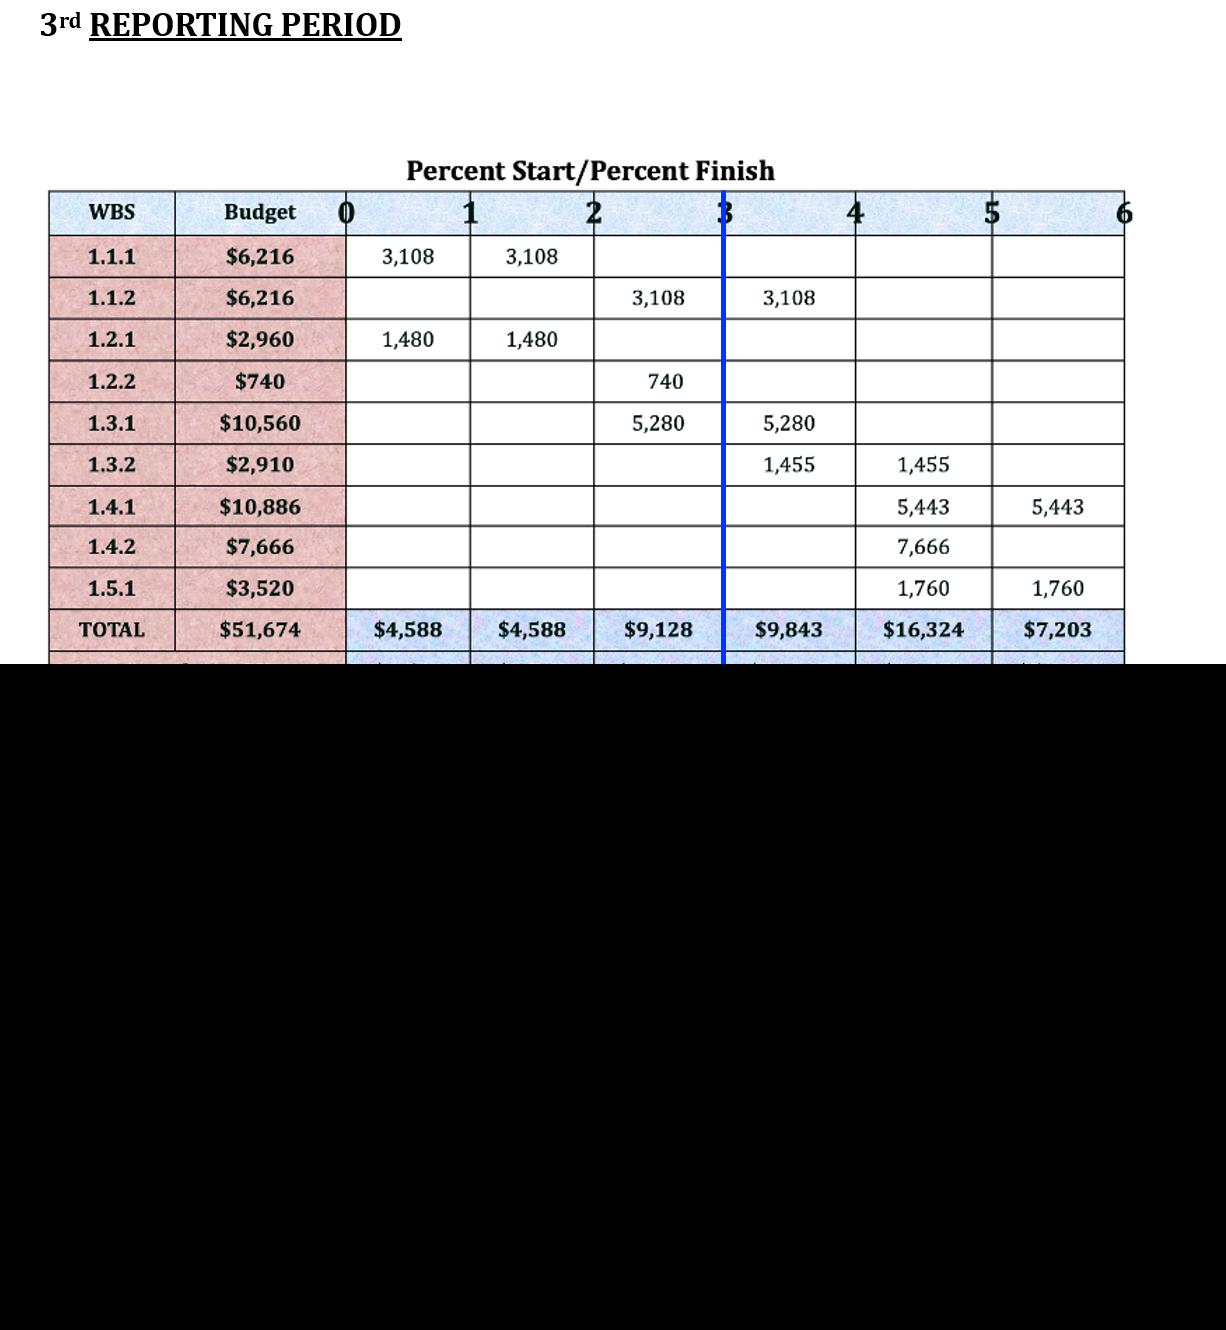
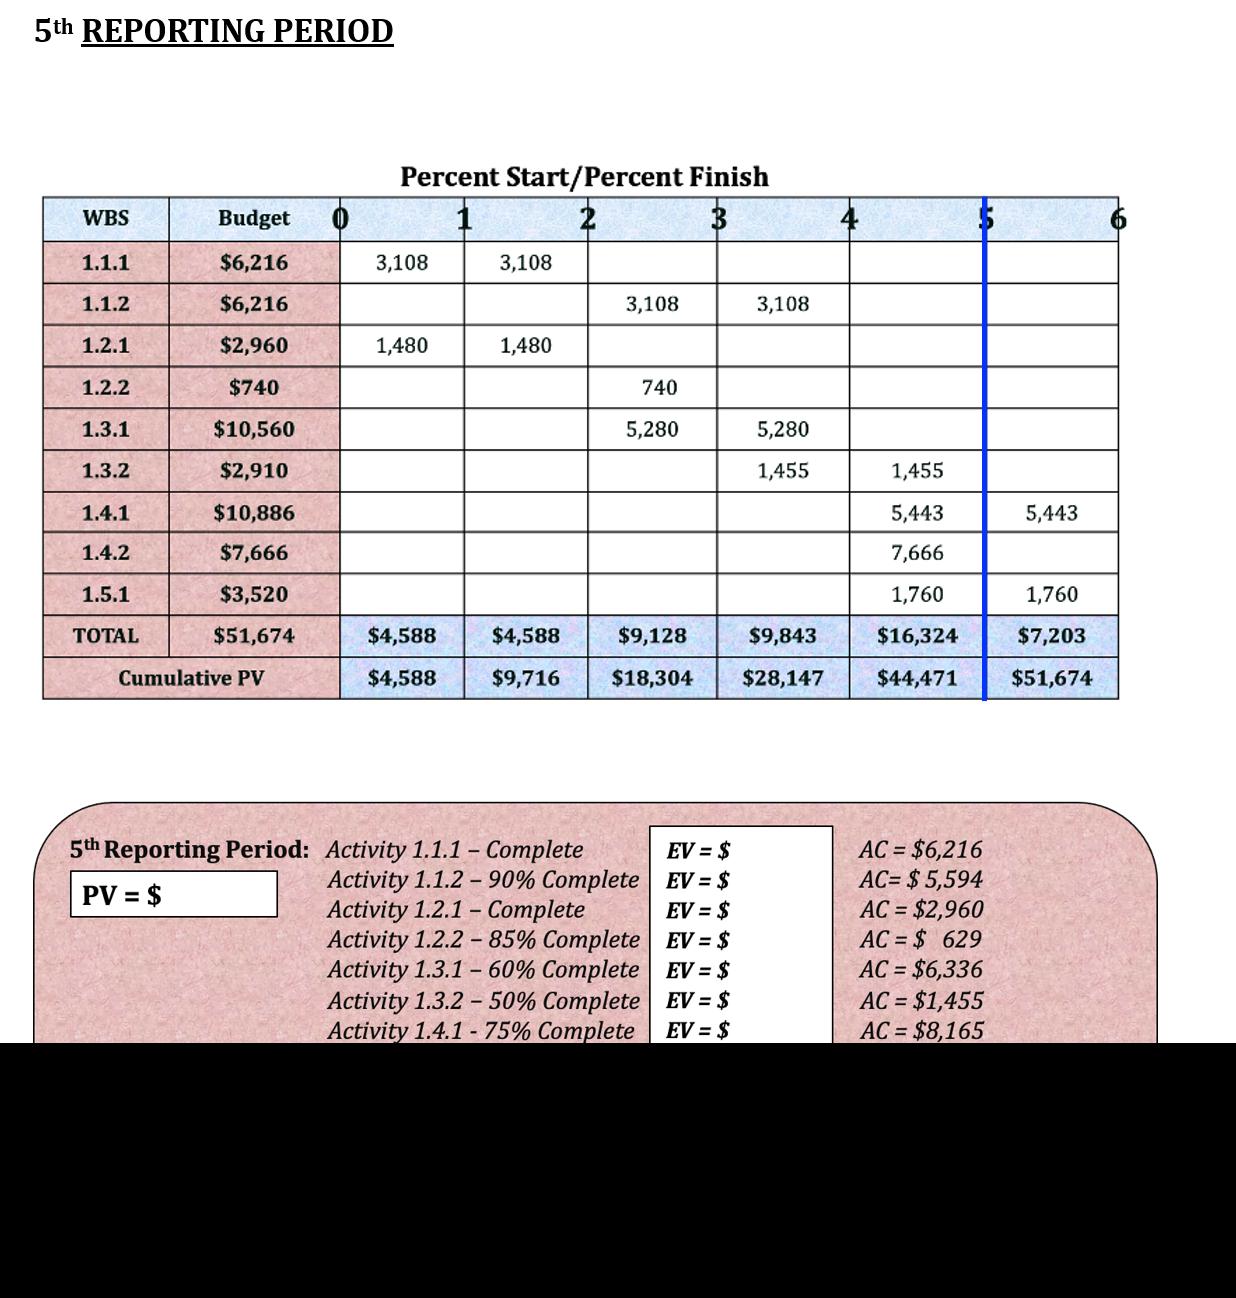
Cost Performance Report 1. This exercise requires you to complete the Earned Value Analysis for the 1st, 3rd, and 5th Reporting Periods. You must provide the: a. Planned Value b. Earned Value for each work activity c. Total Earned Value d. Schedule Variance & Cost Variance (Show all work) e. Schedule Performance Indicator & Cost Performance Indicator (Show all work) 2. Respond to the following questions: a. Based on the documented information what is the Estimate at Completion (EAC) b. What is the To Complete Performance Index C. Is there enough available budget to complete the remaining work? 1st REPORTING PERIOD: Percent Start/Percent Finish WBS Budget 2 3 1.1.1 $6,216 3,108 3,108 1.1.2 $6,216 3,108 3,108 1.2.1 $2,960 1,480 1,480 1.2.2 $740 740 1.3.1 $10,560 5,280 5,280 1.3.2 $2,910 1,455 1,455 1.4.1 $10,886 5,443 5,443 1.4.2 $7,666 7,666 1.5.1 $3,520 1,760 1,760 TOTAL $51,674 $4,588 88 $4, $4,588 $9,128 $9,843 $16,324 $ $7,203 Cumulative PV $4,588 $9,716 $18,304 $28,147 $44,471 $51,674 PV = $ 1st Reporting Period: Activity 1.1.1 - 50% Complete Activity 1.1.2- EV = $ EV = $ AC = $3,108 AC= $ Activity 1.2.1 - 50% Complete EV = $ AC = $1,480 Activity 1.2.2- EV = $ AC = $ Activity 1.3.1- EV = $ AC = $ Activity 1.3.2- EV = $ AC = $ Activity 1.4.1- EV = $ AC = $ Activity 1.4.2 - EV = $ AC = $ Activity 1.5.1- EV = $ AC=$ EV = $ AC = $ SV = SV = $ EV - - - $ PV = $ CV = CV = $ EV - AC - $ = $ 3rd REPORTING PERIOD Percent Start/Percent Finish WBS Budget 1.1.1 $6,216 3,108 3,108 1.1.2 $6,216 3,108 3,108 1.2.1 $2,960 1,480 1,480 1.2.2 $740 740 1.3.1 $10,560 5,280 5,280 1.3.2 $2,910 1,455 1,455 1.4.1 $10,886 5,443 5,443 1.4.2 $7,666 7,666 1.5.1 $3,520 1,760 1,760 TOTAL $51,674 $4,588 $4,588 88 $9 $9,128 $9,843 $16,324 $7,203 5th REPORTING PERIOD Percent Start/Percent Finish WBS Budget 1.1.1 $6,216 3,108 3,108 1.1.2 $6,216 3,108 3,108 1.2.1 $2,960 1,480 1,480 1.2.2 $740 740 1.3.1 $10,560 5,280 5,280 1.3.2 $2,910 1,455 1,455 1.4.1 $10,886 5,443 5,443 1.4.2 $7,666 7,666 1.5.1 $3,520 1,760 1,760 TOTAL $51,674 $4,588 $4,588 $9,128 $9,843 $16,324 $7,203 Cumulative PV $4,588 $9,716 $18,304 $28,147 $44,471 $51,674 5th Reporting Period: Activity 1.1.1 - Complete EV = $ AC = $6,216 PV = $ Activity 1.1.2-90% Complete Activity 1.2.1 - Complete EV = $ AC= $5,594 EV = $ AC = $2,960 Activity 1.2.2 - 85% Complete EV = $ AC = $ 629 Activity 1.3.1-60% Complete EV = $ AC = $6,336 Activity 1.3.2-50% Complete EV = $ AC = $1,455 Activity 1.4.1-75% Complete EV = $ AC = $8,165
Step by Step Solution
There are 3 Steps involved in it

Get step-by-step solutions from verified subject matter experts