

Question: COST-BENEFIT ANALYSIS ECON CLASS Reference - Boardman et al., Cost-benefit Analysis: Concepts and Practice. 4th Ed. Exercise 3: Sensitivity Analysis Reproduce Figure 7.3 and Figure
COST-BENEFIT ANALYSIS ECON CLASS
Reference - Boardman et al., Cost-benefit Analysis: Concepts and Practice. 4th Ed.
Exercise 3: Sensitivity Analysis
Reproduce Figure 7.3 and Figure 7.5. Together with the gures, explain the methodology to compute them; i.e., the idea behind the method and how you did it. The explanation should have about ten to twelve lines for each method. If you are using any programming language, submit the codes. If you are doing it on excel, submit your excel le clearly showing how you are doing each step.
Figure 7.3
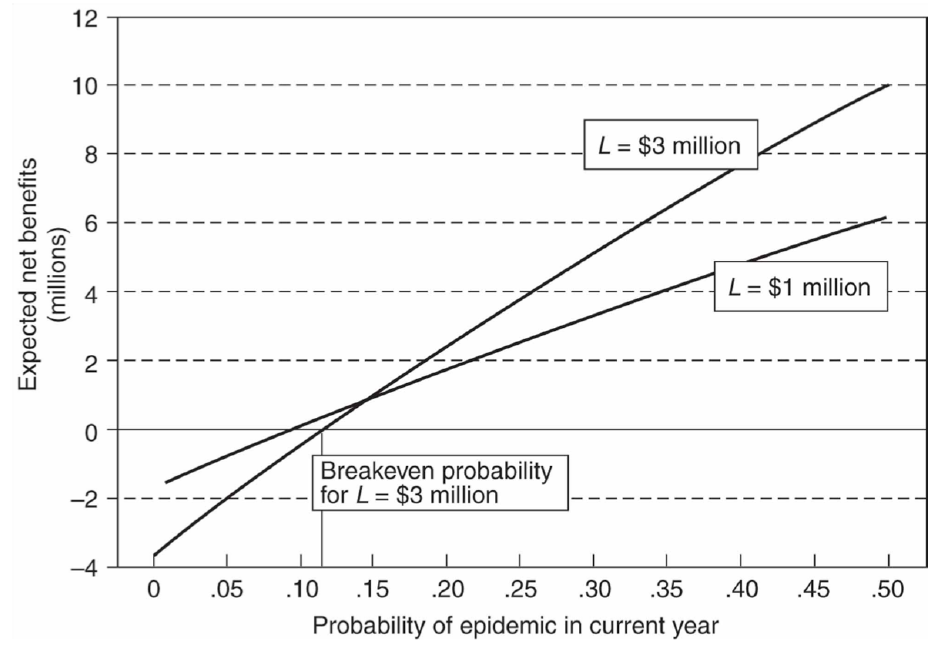
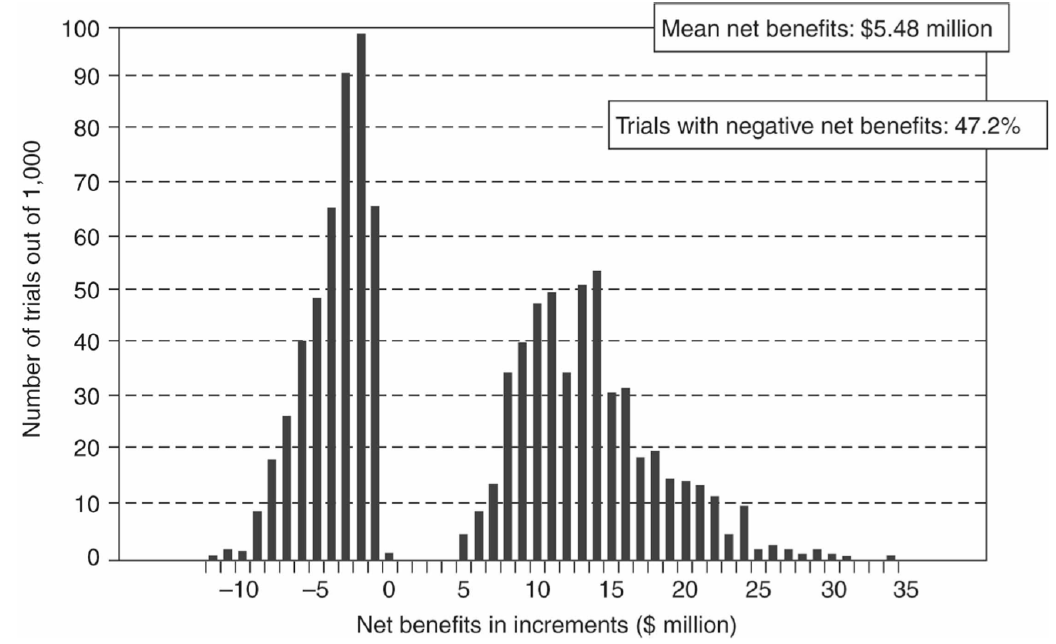
12 10 Expected net benefits 8 --- L = $3 million - - (millions) 6 4 L = $1 million 2 - - - 0 Breakeven probability -2 - for L = $3 million -4 0 .05 .10 .15 .20 .25 .30 .35 .40 .45 .50 Probability of epidemic in current yearNumber of trials out of 1,000 100 90 80 70 60 5O 40 Mean net benefits: $5.43 million Trials with negative net benefits: 47.2% --1O -5 0 5 10 15 20 25 30 35 Net benefits in increments ($ million)
Step by Step Solution
There are 3 Steps involved in it

Get step-by-step solutions from verified subject matter experts