

Question: Could anyone help me out the R-studio scripts? I'm stuck with the scripts to make a few things using R-studio. Thank you very much the
Could anyone help me out the R-studio scripts? I'm stuck with the scripts to make a few things using R-studio. Thank you very much
the picture below is the data which I need to use to make (i) comparative boxplot, (ii) numerical summary, (iii) graphical summary, (iv) histogram,
(i) What are the R-studio scripts to type to make comparative boxplot for type against height, with properly labelled on boxplot?
(ii) What are the R-studio scripts to type to make numerical summary for the type and polinization mode?
(iii) What are the R-studio scripts to type to make graphical summary to visualize the relationship between height and weight, with properly labelled?
(iv) What are the R-studio scripts to type to make histogram for the weight measurements with properly labelled on histogram?
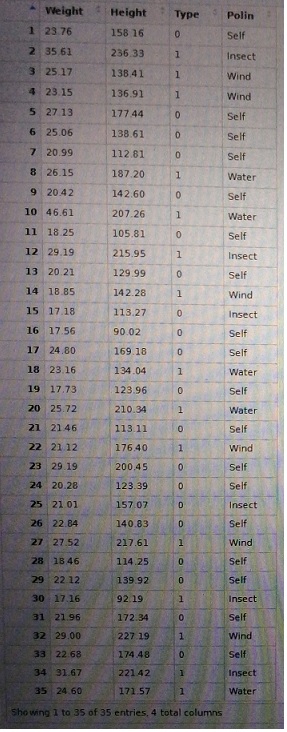
Weight Height Type Polin 1 23 76 156 16 Self 2 35.61 236.33 1 Insect 3 25.17 138.41 1 Wind 29 15 136.91 Wind 5 27 13 177 44 D Self 6 25.06 138.61 D Self 7 20.99 112.81 Self 8 26.15 187.20 Water 9 2042 142.60 Self 10 46.61 207.26 Water 11 18 25 105.81 Self 12 29.19 215.95 Insect 13 20 21 129.99 Self 14 18 85 142.28 Wind 15 17.18 113.27 Insect 16 17 56 90.02 Self 17 24.80 169.18 Self 18 23 16 134.04 Water 19 17.73 123.96 Self 20 25.72 210.34 Water 21 2146 113.11 Self 22 21 12 176.40 Wind 23 29 19 200.45 Self 24 20.28 123.39 Self 25 21 01 157.07 Insect 26 22.84 140.83 Self 27 27.52 217.61 Wind 28 18 46 114.25 Self 29 22 12 139 92 Self 30 17.16 92.19 Insect 31 21.96 172.34 Self 32 29.00 227 19 Wind 33 22 68 174.48 Self 34 31.67 22142 Insect 35 24.60 171.57 1 Water Showing 1 to 35 of 35 entries, 4 total columns
Step by Step Solution
There are 3 Steps involved in it

Get step-by-step solutions from verified subject matter experts