

Question: Could anyone help me with this? Problem 18-1A Comparative statement data for Farris Company and Ratzlaff Company, two competitors, appear below. All balance sheet data
Could anyone help me with this?
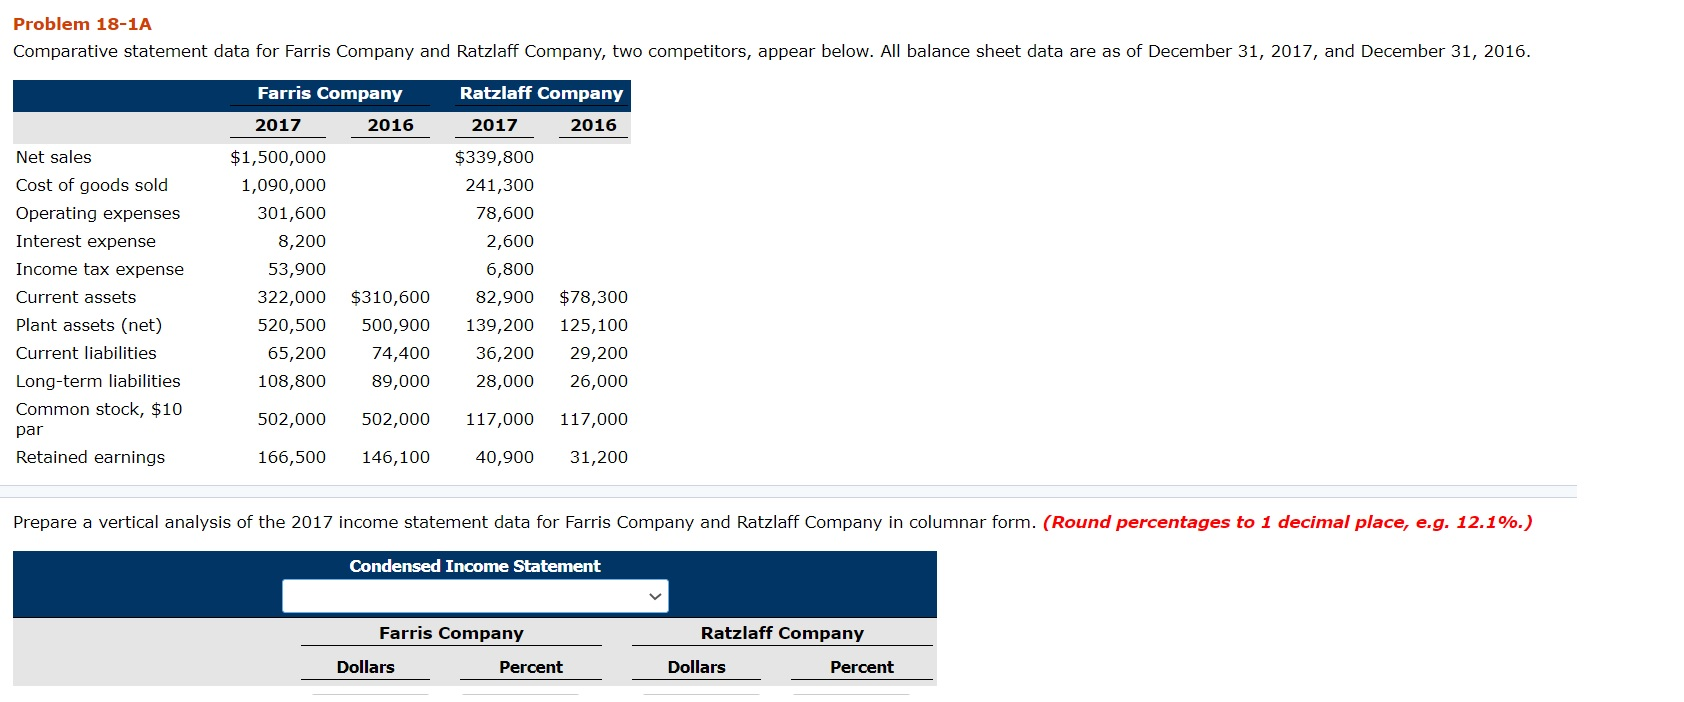
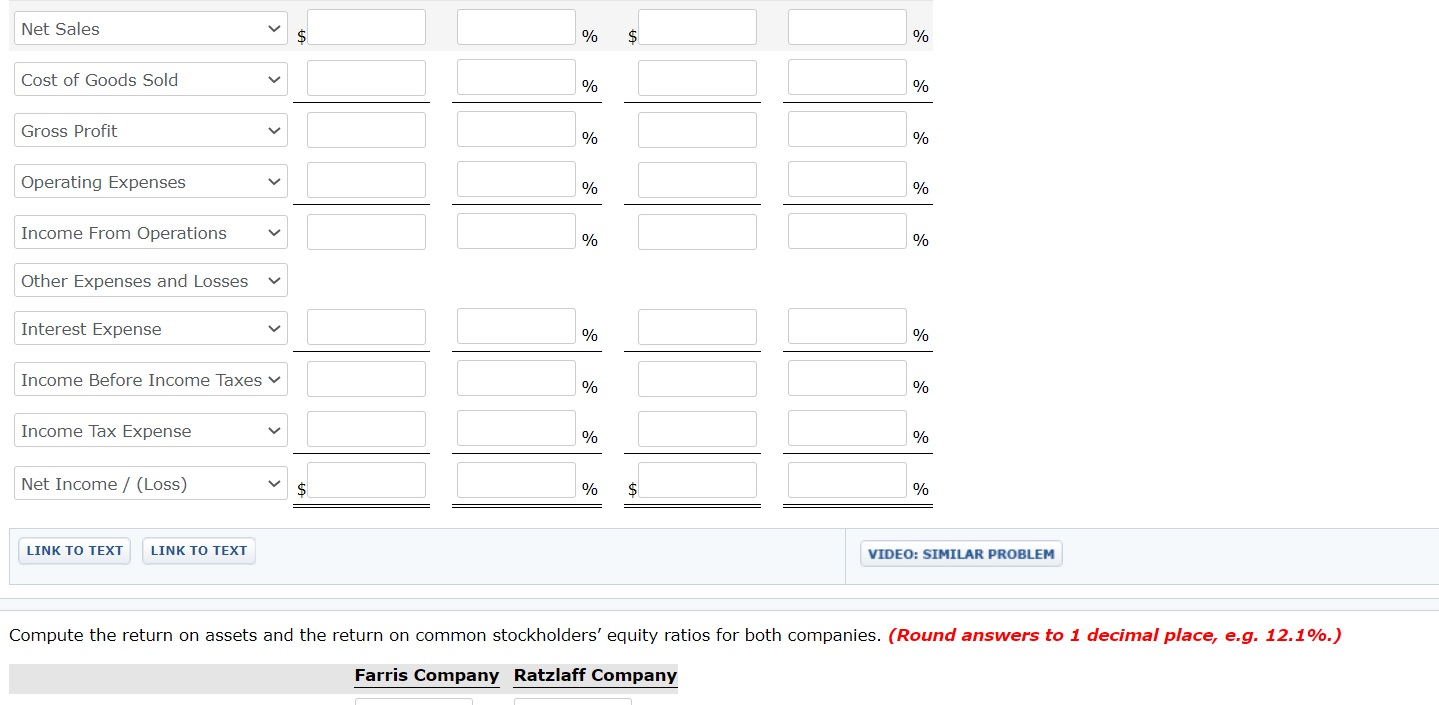

Problem 18-1A Comparative statement data for Farris Company and Ratzlaff Company, two competitors, appear below. All balance sheet data are as of December 31, 2017, and December 31, 2016. Farris Company Ratzlaff Company 2017 2016 2017 2016 Net sales Cost of goods sold Operating expenses Interest expense Income tax expense Current assets Plant assets (net) Current liabilities Long-term liabilities Common stock, $10 par Retained earnings $1,500,000 1,090,000 301,600 8,200 53,900 322,000 520,500 65,200 108,800 $339,800 241,300 78,600 2,600 6,800 82,900 139,200 36,200 28,000 $310,600 500,900 74,400 89,000 $78,300 125,100 29,200 26,000 502,000 502,000 117,000 117,000 166,500 146,100 40,900 31,200 Prepare a vertical analysis of the 2017 income statement data for Farris Company and Ratzlaff Company in columnar form. (Round percentages to 1 decimal place, e.g. 12.1%.) Condensed Income Statement Farris Company Ratzlaff Company Dollars Percent Dollars Percent Net Sales > % $ % Cost of Goods Sold % % Gross Profit % % Operating Expenses % % Income From Operations % %
Step by Step Solution
There are 3 Steps involved in it

Get step-by-step solutions from verified subject matter experts