

Question: Problem 18-1A Comparative statement data for Farris Company and Ratzlaff Company, two competitors, appear below. All balance sheet data are as of December 31, 2017,
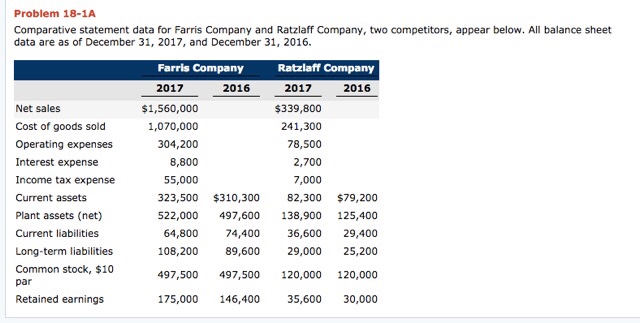
Problem 18-1A Comparative statement data for Farris Company and Ratzlaff Company, two competitors, appear below. All balance sheet data are as of December 31, 2017, and December 31, 2016 Farris Company Ratzlaff Company 2016 2016 2017 $1,560,000 1,070,000 304,200 $339,800 241,300 78,500 2,700 7,000 Net sales Cost of goods sold Operating expenses Interest expense Income tax expense Current assets Plant assets (net) Current liabilities Long-term liabilities Common stock, $10 par Retained earnings 8,800 55,000 323,500 $310,300 82,300 $79,200 522,000 497,600 138,900 125,400 74,400 36,600 29,400 89,600 29,000 25,200 497,500 497,500 120,000 120,000 175,000 146,400 35,600 30,000 64,800 108,200
Step by Step Solution
There are 3 Steps involved in it

Get step-by-step solutions from verified subject matter experts