

Question: Could anyone solve this problem ? thank you. The table 1 below shows the data of daily demand and production routing of 6 parts. Table
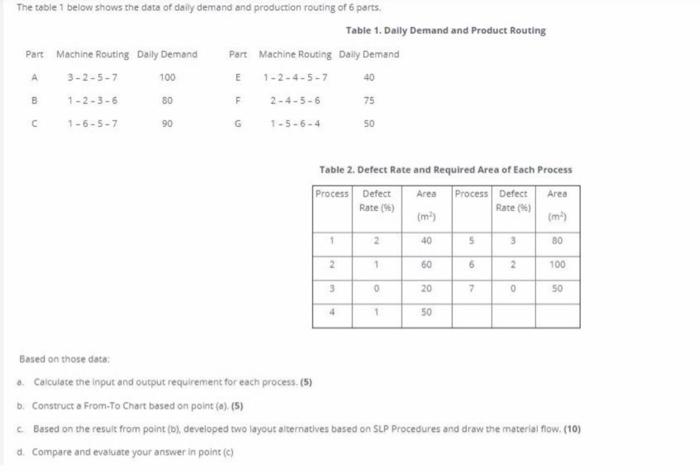
The table 1 below shows the data of daily demand and production routing of 6 parts. Table 1. Dally Demand and Product Routing Part Machine Routing Dally Demand Part Machine Routing Dally Demand 3-2-5-7 100 E 1-2-4-5-7 40 B 1-2-3-6 80 F 2-4-5-6 75 A 1-6-5-7 90 1-5-6-4 50 Table 2. Defect Rate and Required Area of Each Process Process Defect Area Process Defect Area Rate (4) Rate (*) (m) (m) 1 2 40 5 80 2 1 60 6 2 100 3 0 20 7 0 50 4 1 50 Based on those date: Calculate the input and output requirement for each process. (5) bi Construct a From-To Chart based on point (a). (5) Based on the result from point (b), developed two layout alternatives based on SLP Procedures and draw the material flow. (10) d. Compare and evaluate your answer in point (c) The table 1 below shows the data of daily demand and production routing of 6 parts. Table 1. Dally Demand and Product Routing Part Machine Routing Dally Demand Part Machine Routing Dally Demand 3-2-5-7 100 E 1-2-4-5-7 40 B 1-2-3-6 80 F 2-4-5-6 75 A 1-6-5-7 90 1-5-6-4 50 Table 2. Defect Rate and Required Area of Each Process Process Defect Area Process Defect Area Rate (4) Rate (*) (m) (m) 1 2 40 5 80 2 1 60 6 2 100 3 0 20 7 0 50 4 1 50 Based on those date: Calculate the input and output requirement for each process. (5) bi Construct a From-To Chart based on point (a). (5) Based on the result from point (b), developed two layout alternatives based on SLP Procedures and draw the material flow. (10) d. Compare and evaluate your answer in point (c)
Step by Step Solution
There are 3 Steps involved in it

Get step-by-step solutions from verified subject matter experts