

Question: Could I get help with a step by step tutorial? An airline operates a call center to handle customer questions and complaints. The airline monitors
Could I get help with a step by step tutorial?
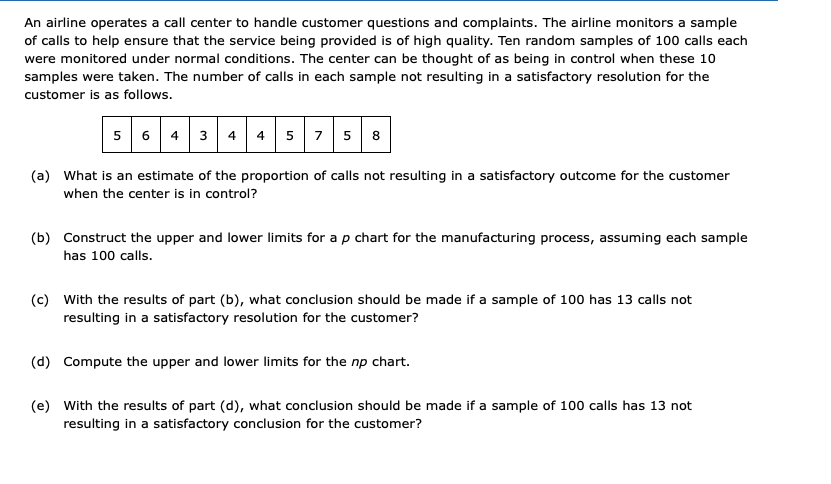
An airline operates a call center to handle customer questions and complaints. The airline monitors a sample of calls to help ensure that the service being provided is of high quality. Ten random samples of 100 calls each were monitored under normal conditions. The center can be thought of as being in control when these 10 samples were taken. The number of calls in each sample not resulting in a satisfactory resolution for the customer is as follows. 5 6 4 5 8 (a) What is an estimate of the proportion of calls not resulting in a satisfactory outcome for the customer when the center is in control? (b) Construct the upper and lower limits for a p chart for the manufacturing process, assuming each sample has 100 calls. (c) With the results of part (b), what conclusion should be made if a sample of 100 has 13 calls not resulting in a satisfactory resolution for the customer? (d) Compute the upper and lower limits for the np chart. (e) With the results of part (d), what conclusion should be made if a sample of 100 calls has 13 not resulting in a satisfactory conclusion for the customer
Step by Step Solution
There are 3 Steps involved in it

Get step-by-step solutions from verified subject matter experts