

Question: Could someone help with the last two questions? (See attached photo) The following histogram shows the percentage of residential properties in negative equity or near
Could someone help with the last two questions? (See attached photo)
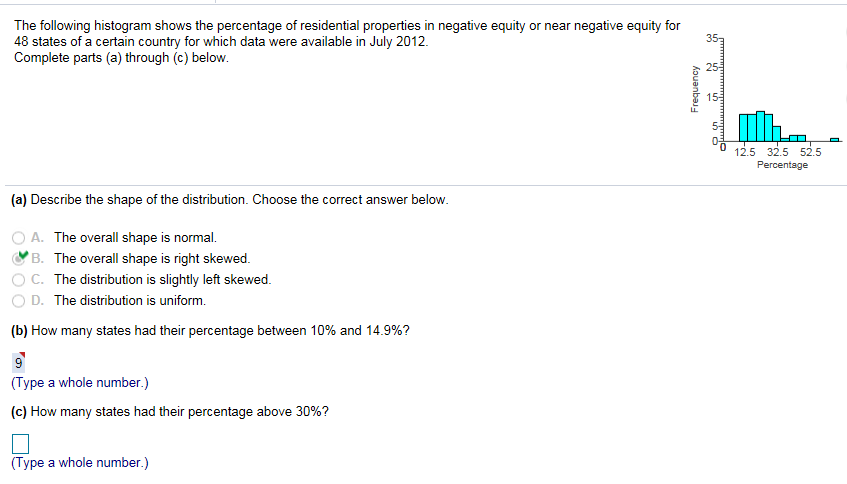
The following histogram shows the percentage of residential properties in negative equity or near negative equity for 43 states of a certain country for which data were available in July 2012. 3 Complete parts (a) through to} below. Frequency "12.5 32.5 52.5 F'eroenlage [3] Describe the shape of the distribution. Choose the correct answer below. - t. The overall shape is normal. A? El. The overall shape is right skewed. - C. The distribution is slightly left skewed. - D. The distribution is uniform. [b] How many states had their percentage between 10% and 14.9%? '1 9 {Type a whole number.) [-3] How many states had their percentage above 30%? E {Type a whole number.)
Step by Step Solution
There are 3 Steps involved in it

Get step-by-step solutions from verified subject matter experts