

Question: The data shown below indicate the average tuition (in dollars) over six-year period for private and public colleges in a region. Complete parts a through
The data shown below indicate the average tuition (in dollars) over six-year period for private and public colleges in a region. Complete parts a through c below.
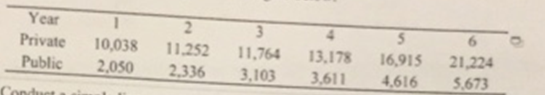
a. Conduct a simple linear regression analysis of these data in which the average tuition for private colleges is predicted by the average public college tuition. Test the significance of the model using ? =0.10
What is the estimated regression slope coefficient?
What is the estimate regression intercept?
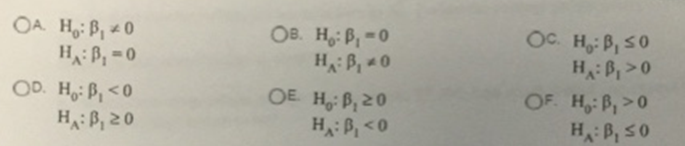
b. To test the significance, first determine the hypotheses to test, Choose the correct answer below.
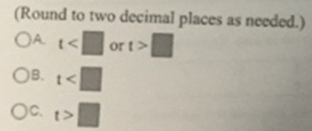
c. Determine the rejection region for the test statistics t for ? = 0.10. Select the correct choice below and fill in any answer boxes to complete your choice
Calculate the simple linear regression test statistics t.
Year Private 10,038 Public 2,050 Conduc 3 5 2 11.252 11,764 13,178 16,915 2,336 3,103 3,611 4,616 21,224 5,673 OA. H: B 0 H: B = 0 OD. Ho: B 0 H: B, so (Round to two decimal places as needed.) OA 1 < or t> OB. 1 < OC. t>
Step by Step Solution
3.42 Rating (146 Votes )
There are 3 Steps involved in it
To perform the simple linear regression analysis given the data for private Y and public X college t... View full answer

Get step-by-step solutions from verified subject matter experts
Document Format (2 attachments)
6096acbd57a04_27092.pdf
180 KBs PDF File
6096acbd57a04_27092.docx
120 KBs Word File