

Question: Could use some help here, any advice would be greatly appreciated, data attached. you want to know the average age and average 1-year compensation of
Could use some help here, any advice would be greatly appreciated, data attached.
you want to know the average age and average 1-year compensation of highst paid CEO's. You contact a CEO placement company. They provide you with a sample of 50 CEOs, their compensation and age.
- Obtain 95% confidence interval for the mean 1-Year comp. and mean age. Does your confidence interval contain the population mean 1-Year compensation and population mean age?
- Find probability that the average compensation for the 50 randomly selected CEOs is more than the sample mean; under the assumption the true mean is8 million dollars.
- The placement service claims that the average compensation for CEO placed by their services is more than 8 million dollars. Assuming the sample given is obtained from the placement services; does the sample support the placement services claim? Test the hypothesis at 5% Level and state your conclusion. Is your p-value close to the answer obtained in part (b), explain.
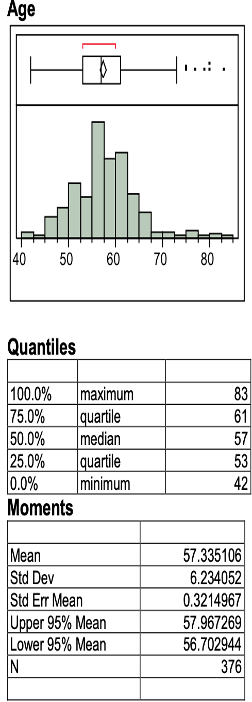
Obtain the 95% confidence interval for the mean 1-Year compensation and mean age. Does your confidence interval contain the population mean 1-


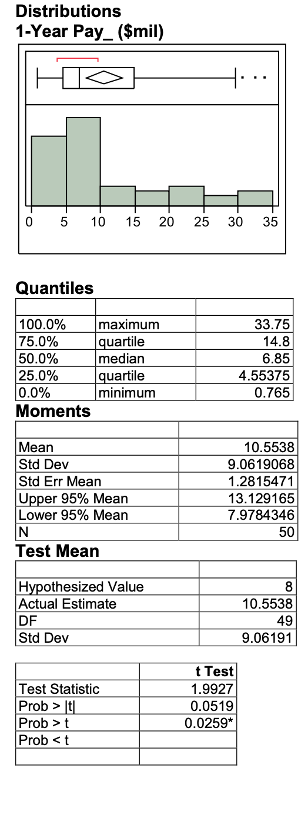
Distributions 1-Year Pay_ ($mil) 0 5 10 15 20 25 30 35 Quantiles 100.0% maximum 33.75 75.0% quartile 14.8 50.0% median 6.85 25.0% quartile 4.55375 0.0% minimum 0.765 Moments Mean 10.5538 Std Dev 9.0619068 Sid Err Mean 1.2815471 Upper 95% Mean 13.129165 Lower 95% Mean 7.9784346 N 50 Test Mean Hypothesized Value 8 Actual Estimate 10.5538 DF 49 Std Dev 9.06191 t Test Test Statistic 1.9927 Prob > It 0.0519 Prob > t 0.0259' Prob It 0.0519 Prob > t 0.0259* Prob
Step by Step Solution
There are 3 Steps involved in it

Get step-by-step solutions from verified subject matter experts