

Question: Use the data in the table above to plot In[t-BuCl]; vs time (s). Include labeled axis, a title, and a linear trendline. Upload your plot
Use the data in the table above to plot In[t-BuCl]; vs time (s). Include labeled axis, a title, and a linear trendline. Upload your plot here.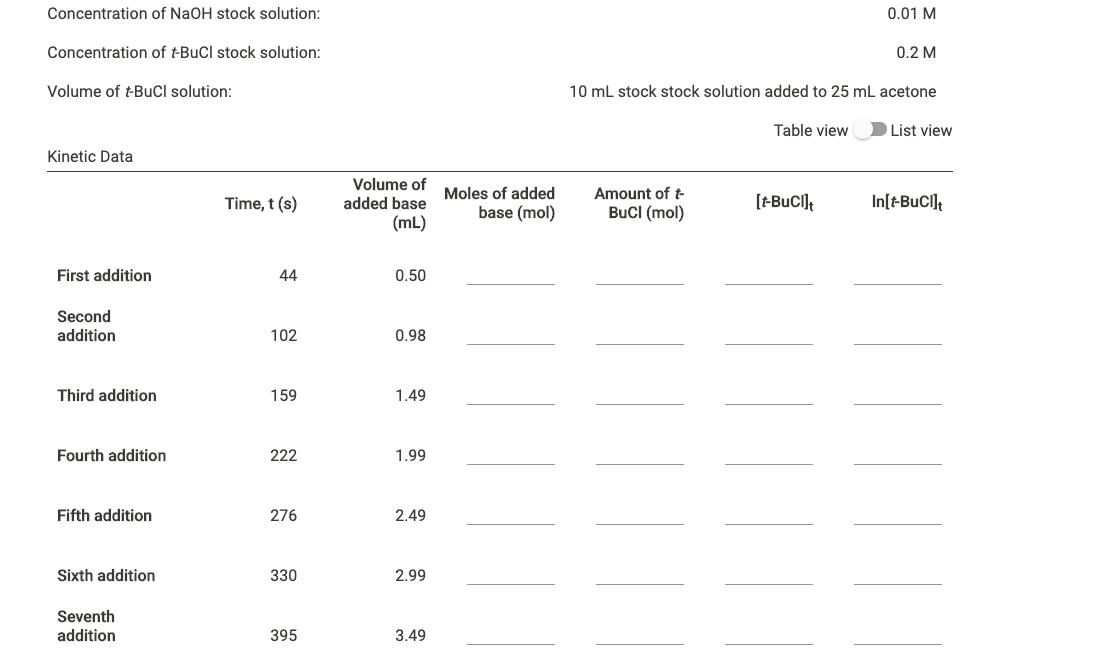
Concentration of NaOH stock solution: 0.01 M Concentration of tBuCl stock solution: 0.2 M Volume of t-BuCl solution: 10 mL stock stock solution added to 25 mL acetone Table view List view Kinetic Data Volume of Moles of added added base Amount of t Time, t (s) base (mol) BuCI (mol) [-Buci] In[-BuCI] (mL) First addition 44 0.50 Second addition 102 0.98 Third addition 159 1.49 Fourth addition 222 1.99 Fifth addition 276 2.49 Sixth addition 330 2.99 Seventh addition 395 3.49
Step by Step Solution
3.37 Rating (150 Votes )
There are 3 Steps involved in it

Get step-by-step solutions from verified subject matter experts