

Question: could you please answer the question in the picture below 1 Caption IDI AaBbC: AaBbCc A:Bby tacos. ABBCCD A4BbCCC Sydney City Campus_51_2028 Heading 1 Heading
could you please answer the question in the picture below
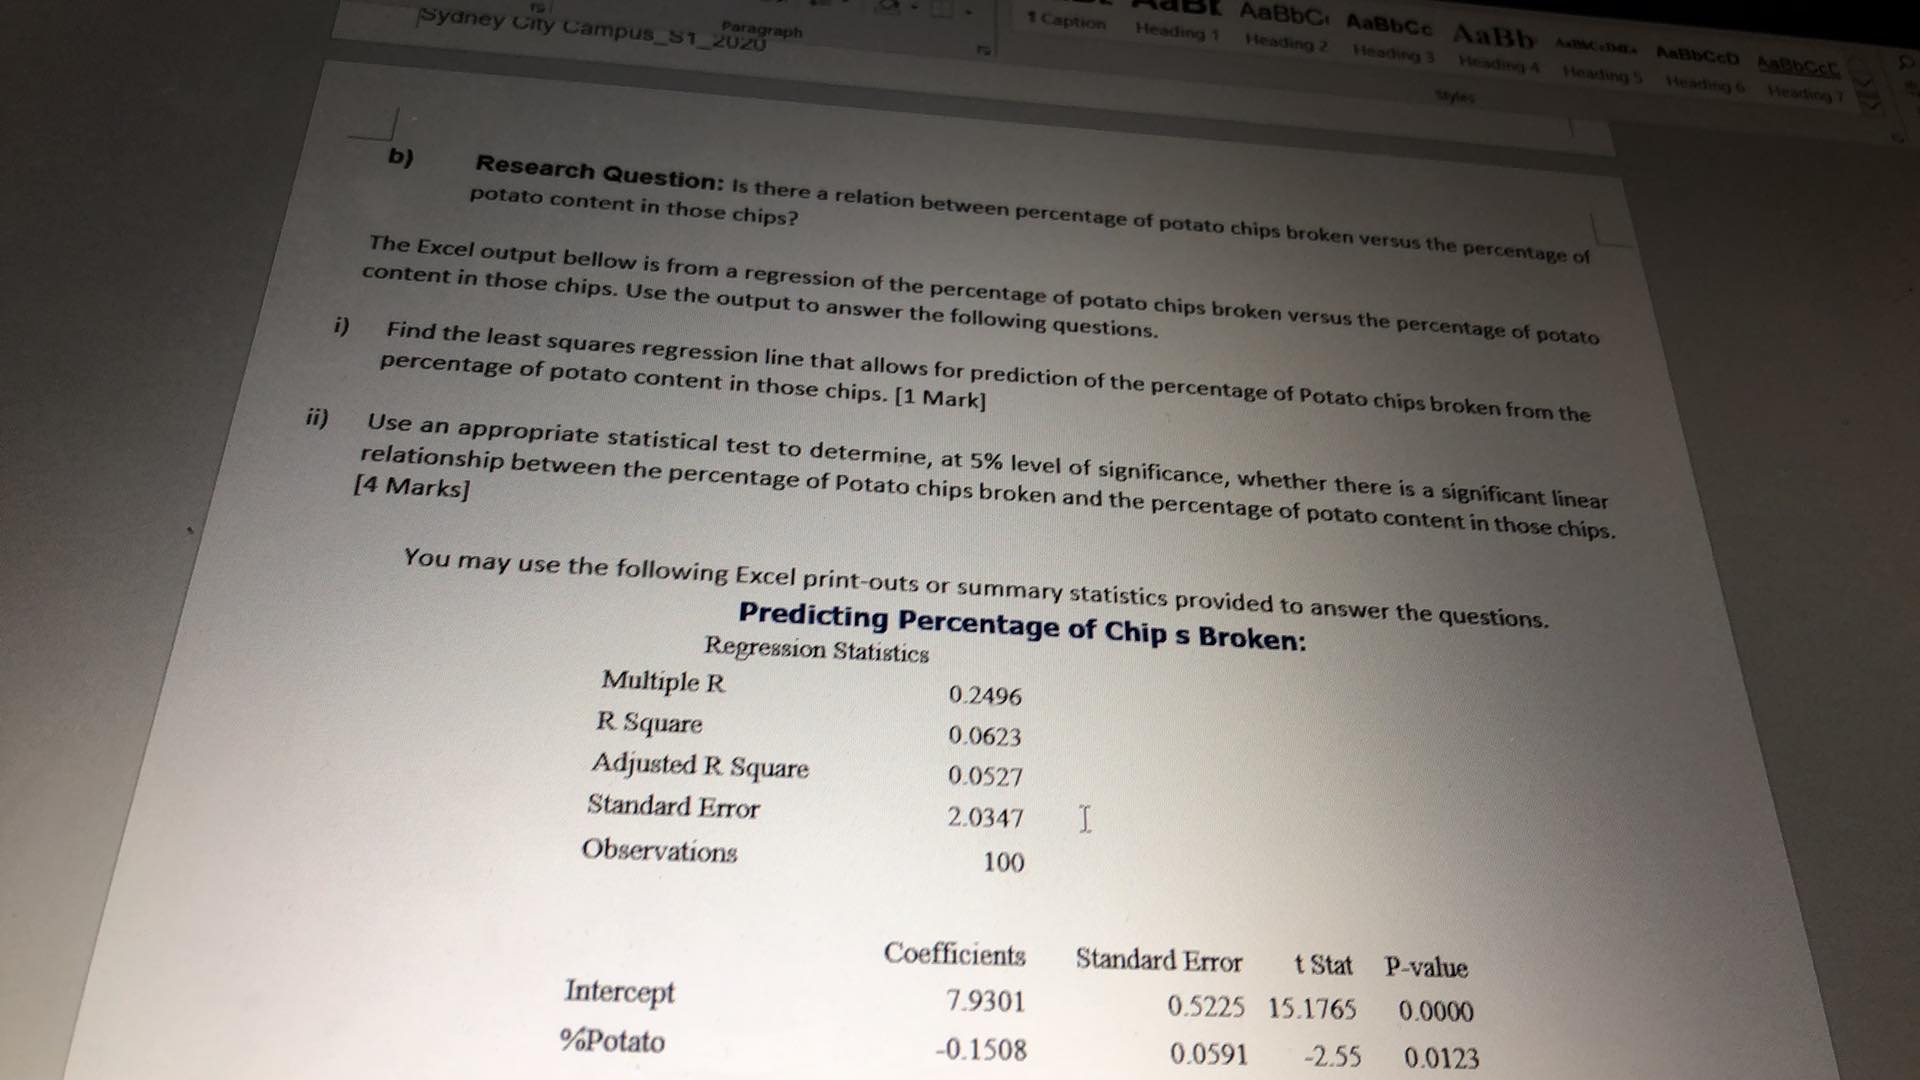
1 Caption IDI AaBbC: AaBbCc A:Bby tacos. ABBCCD A4BbCCC Sydney City Campus_51_2028 Heading 1 Heading 2 Heading 3 Heading 4 Heading Heading 6 Heating b) Research Question: Is there a relation between percentage of potato chips broken versus the percentage of potato content in those chips? The Excel output bellow is from a regression of the percentage of potato chips broken versus the percentage of potato content in those chips. Use the output to answer the following questions. i) Find the least squares regression line that allows for prediction of the percentage of Potato chips broken from the percentage of potato content in those chips. [1 Mark] ii) Use an appropriate statistical test to determine, at 5% level of significance, whether there is a significant linear [4 Marks] relationship between the percentage of Potato chips broken and the percentage of potato content in those chips. You may use the following Excel print-outs or summary statistics provided to answer the questions. Predicting Percentage of Chip s Broken: Regression Statistics Multiple R 0.2496 R Square 0.0623 Adjusted R Square 0.0527 Standard Error 2.0347 I. Observations 100 Coefficients Standard Error t Stat P-value Intercept 7.9301 0.5225 15.1765 0.0000 %Potato -0.1508 0.0591 -2.55 0.0123
Step by Step Solution
There are 3 Steps involved in it

Get step-by-step solutions from verified subject matter experts