

Question: could you please help explain what the numbers mean in the attached chart? day month cases deaths popData2019 count 24613.000000 24613.000000 24613.000000 24613.000000 2.461300e+04 mean
could you please help explain what the numbers mean in the attached chart?
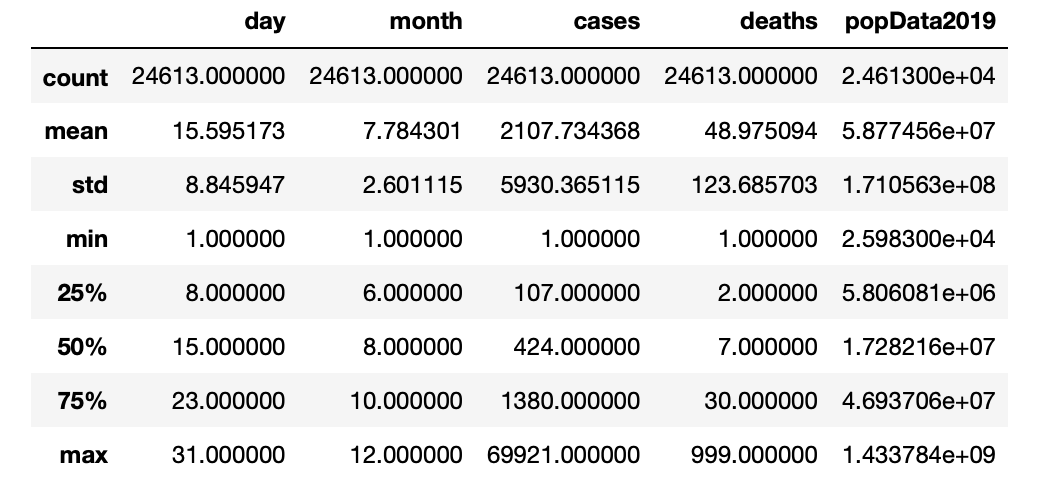
day month cases deaths popData2019 count 24613.000000 24613.000000 24613.000000 24613.000000 2.461300e+04 mean 15.595173 7.784301 2107.734368 48.975094 5.877456e+07 std 8.845947 2.601115 5930.365115 123.685703 1.710563e+08 min 1.000000 1.000000 1.000000 1.000000 2.598300e+04 25% 8.000000 6.000000 107.000000 2.000000 5.806081e+06 50% 15.000000 8.000000 424.000000 7.000000 1.728216e+07 75% 23.000000 10.000000 1380.000000 30.000000 4.693706e+07 max 31.000000 12.000000 69921.000000 999.000000 1.433784e+09
Step by Step Solution
There are 3 Steps involved in it
1 Expert Approved Answer
Step: 1 Unlock

Question Has Been Solved by an Expert!
Get step-by-step solutions from verified subject matter experts
Step: 2 Unlock
Step: 3 Unlock