

Question: Could you please help me answer this multipart question? 1. The following graph represents the change in concentration of H2O2 over time. a) Calculate the
Could you please help me answer this multipart question? 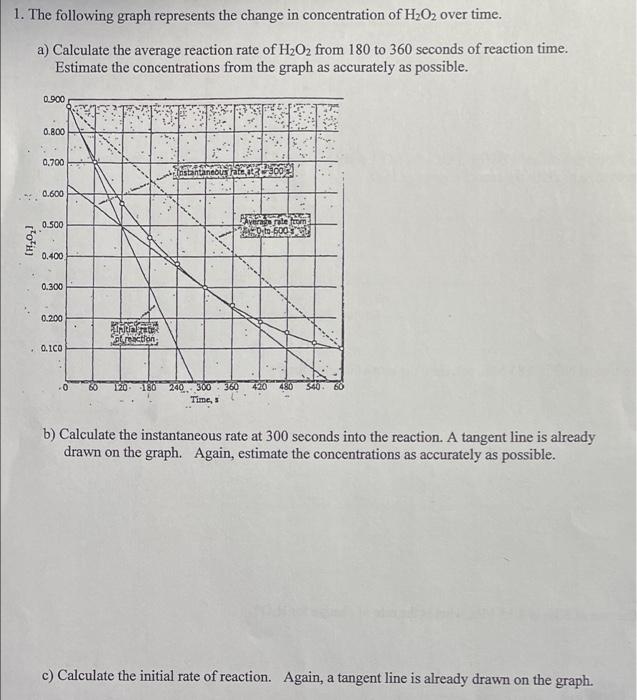
1. The following graph represents the change in concentration of H2O2 over time. a) Calculate the average reaction rate of H2O2 from 180 to 360 seconds of reaction time. Estimate the concentrations from the graph as accurately as possible. 0.900 0.800 0.700 0.600 0.500 183) poft 0.400 0.300 0.200 rection 0.ICO 240300 360 Times b) Calculate the instantaneous rate at 300 seconds into the reaction. A tangent line is already drawn on the graph. Again, estimate the concentrations as accurately as possible. c) Calculate the initial rate of reaction. Again, a tangent line is already drawn on the graph
Step by Step Solution
There are 3 Steps involved in it
1 Expert Approved Answer
Step: 1 Unlock

Question Has Been Solved by an Expert!
Get step-by-step solutions from verified subject matter experts
Step: 2 Unlock
Step: 3 Unlock