

Question: Could you please help me with this question. Using the data set you collected in Week 1, excluding the super car outlier, you should have


Could you please help me with this question.
Using the data set you collected in Week 1, excluding the super car outlier, you should have calculated the mean and standard deviation during Week 2 for price data.
Along with finding a p and q from Week 3.
Using this information, calculate two 95% confidence intervals.
For the first interval you need to calculate a T-confidence interval for the sample population.
You have the mean, standard deviation and the sample size, all you have left to find is the T-critical value and you can calculate the interval.
For the second interval calculate a proportion confidence interval using the proportion of the number of cars that fall below the average.
You have the p, q, and n, all that is left is calculating a Z-critical value,
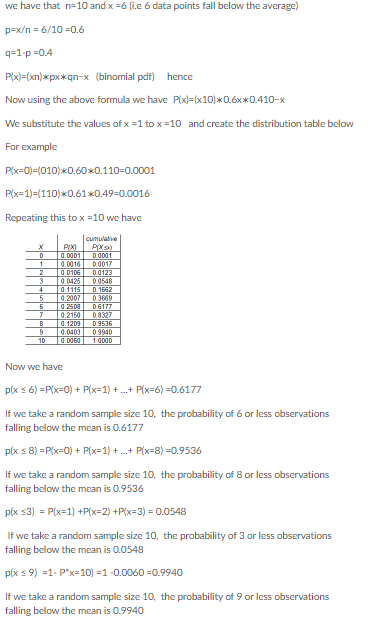
we have that n=10 and x =6 (i.e 6 data points fall below the average) p=x = 6/10=0.6 q=1-p =0.4 P(x)=(xn)*px*qn-x (binomial pdf) hence Now using the above formula we have P(x]=(x10)*0.6x*0.410-x We substitute the values of x =1 to x =10 and create the distribution table below For example P(x=0)=(010)*0.60*0.110=0.0001 P(x=1)=(110)*0.61*0.49=0.0016 Repeating this to x =10 we have X D 0.0101 DO01 1 0.0016 0 9017 0.0106 0 0123 0.0425 0 0646 4 0.1115 D.1662 6 9.2007 0 3619 0.2503 0617T 0.2160 0 8327 B 0.1203 9056 0 9 0.0403 09040 10 1 0000 Now we have p(x = 6) =P(x=0) + P(x=1) + ...+ P(x=6) =0.6177 If we take a random sample size 10, the probability of 6 or less observations falling below the mean is 0.6177 p(x
Step by Step Solution
There are 3 Steps involved in it

Get step-by-step solutions from verified subject matter experts