

Question: Could you please provide the solution to this question? Please draw graphs or tables etc if needed to answer the question and show FULL working
Could you please provide the solution to this question?
Please draw graphs or tables etc if needed to answer the question and show FULL working out when doing calculations.
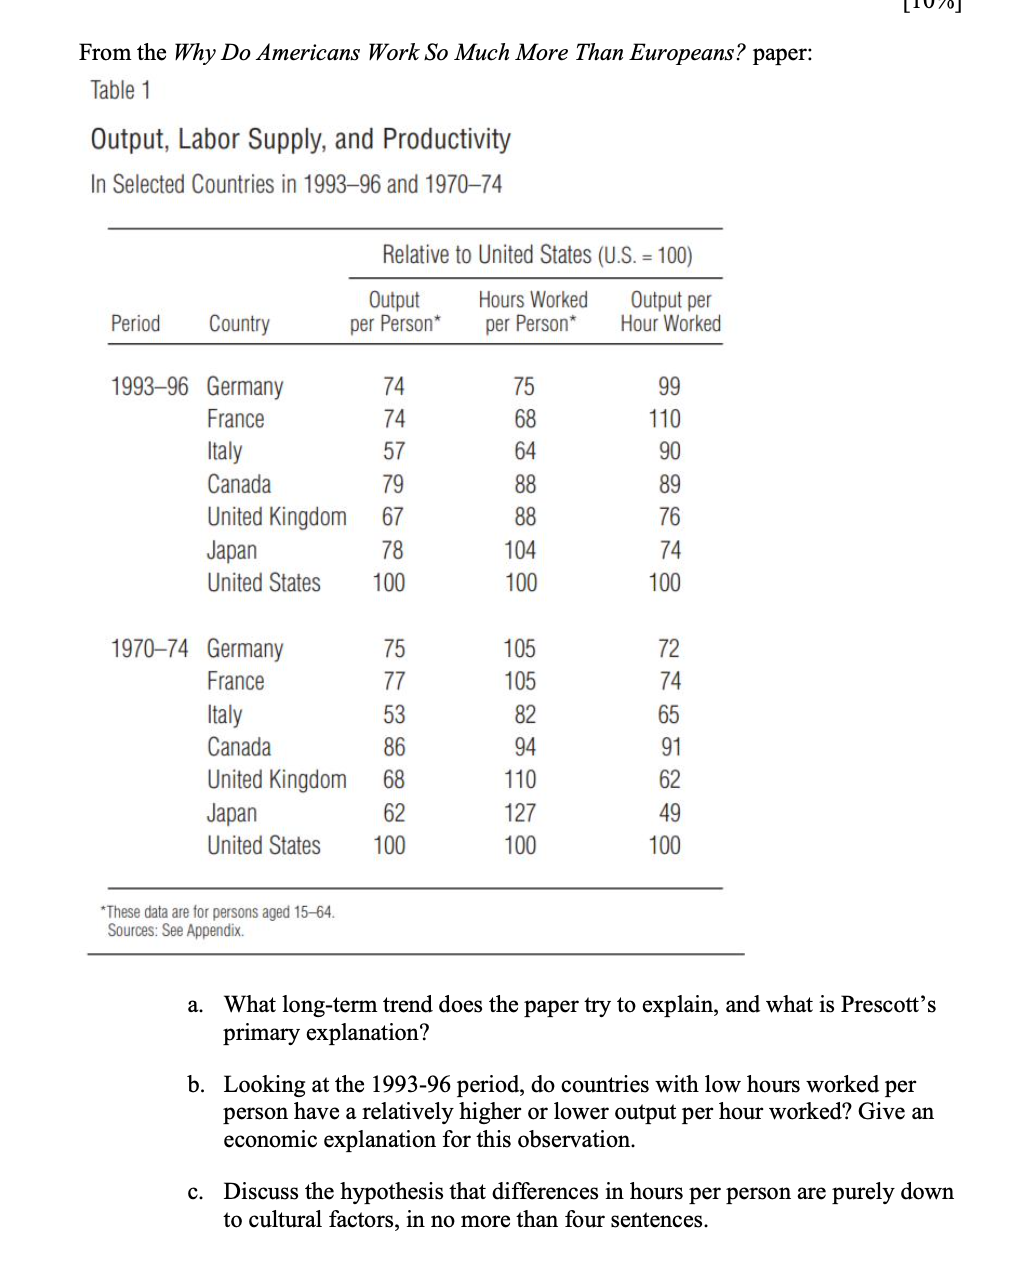
From the Why Do Americans Work So Much More Than Europeans? paper: Table 1 Output, Labor Supply, and Productivity In Selected Countries in 1993-96 and 1970-74 Relative to United States (U.S. = 100) Output Hours Worked Output per Period Country per Person* per Person Hour Worked 1993-96 Germany 74 75 99 France 74 68 110 Italy 57 64 90 Canada 79 88 89 United Kingdom 67 88 76 Japan 78 104 74 United States 100 100 100 1970-74 Germany 75 105 72 France 77 105 74 Italy 53 82 65 Canada 86 94 91 United Kingdom 68 110 62 Japan 62 127 49 United States 100 100 100 These data are for persons aged 15-64. Sources: See Appendix. a. What long-term trend does the paper try to explain, and what is Prescott's primary explanation? b. Looking at the 1993-96 period, do countries with low hours worked per person have a relatively higher or lower output per hour worked? Give an economic explanation for this observation. c. Discuss the hypothesis that differences in hours per person are purely down to cultural factors, in no more than four sentences
Step by Step Solution
There are 3 Steps involved in it

Get step-by-step solutions from verified subject matter experts