

Question: Could you please provide the solution to this question? Please draw graphs, diagrams, tables etc if needed to answer the question and show FULL working
Could you please provide the solution to this question?
Please draw graphs, diagrams, tables etc if needed to answer the question and show FULL working out when doing calculations.
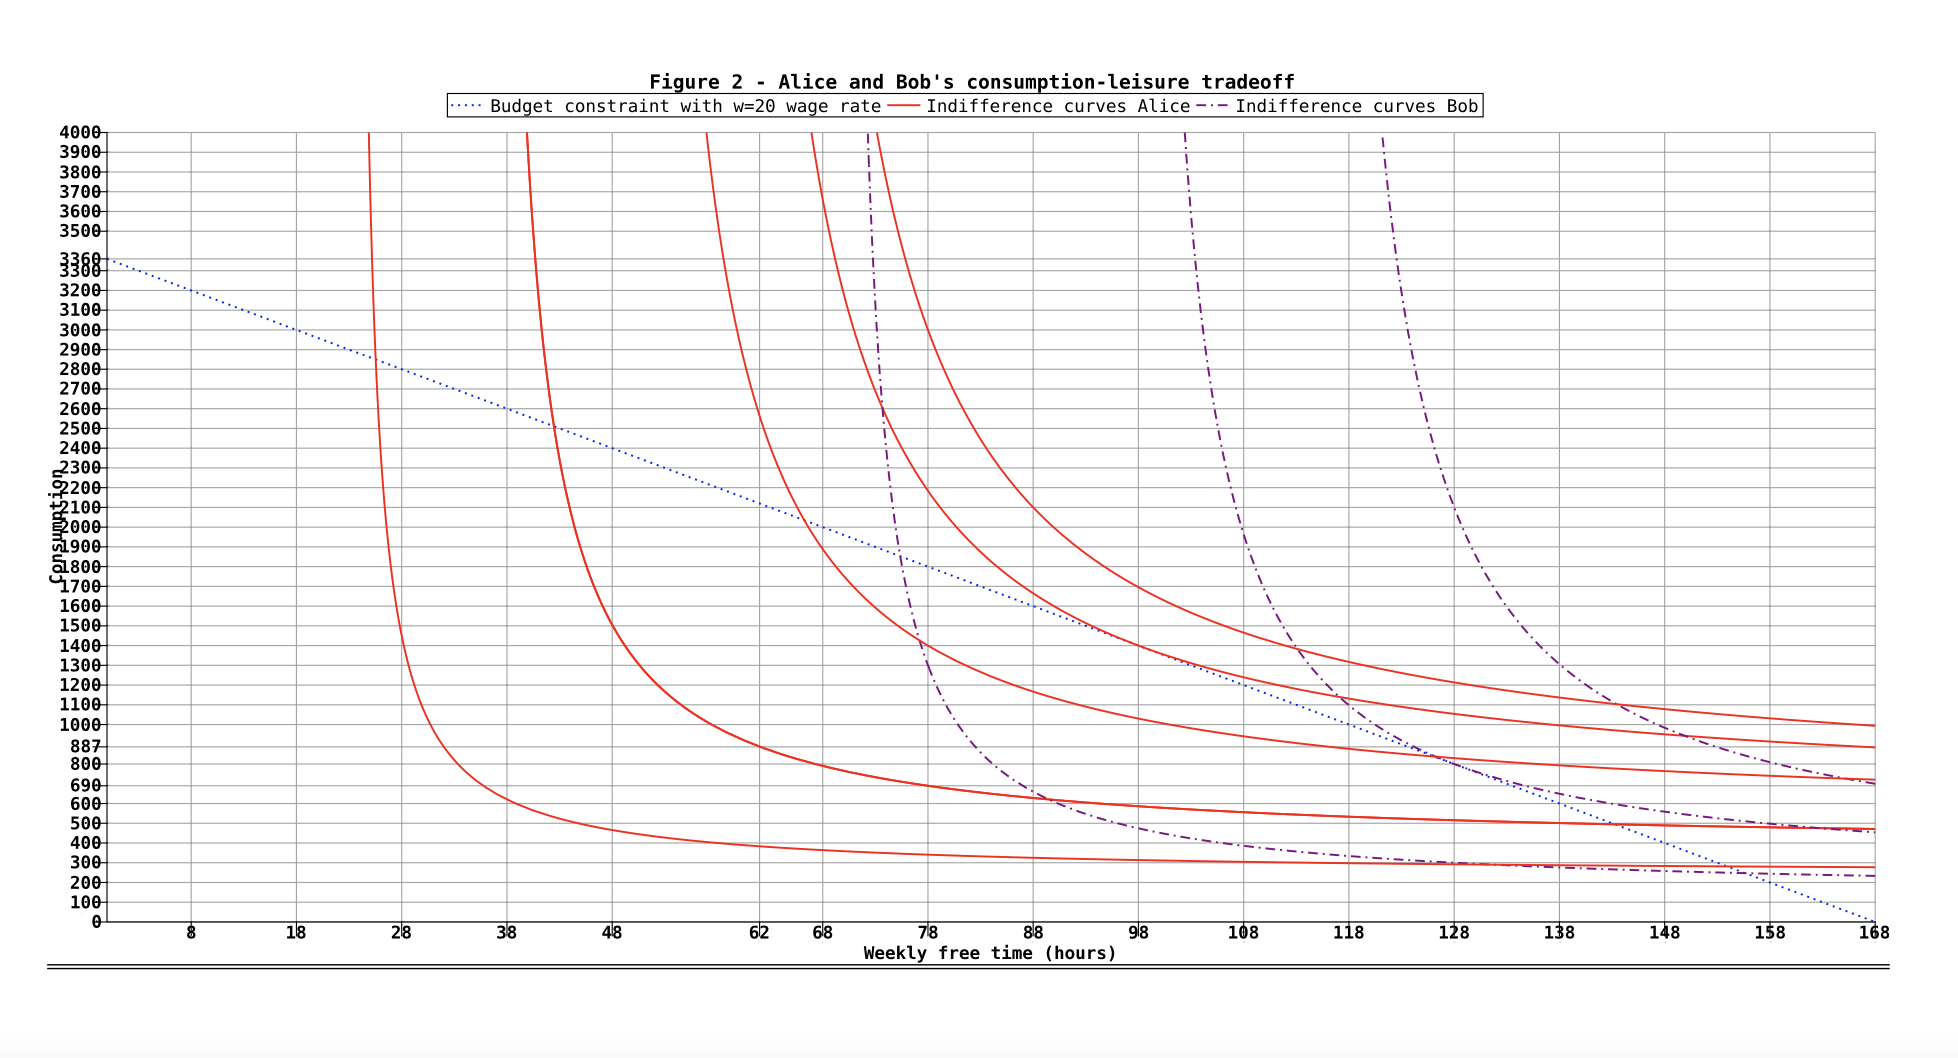
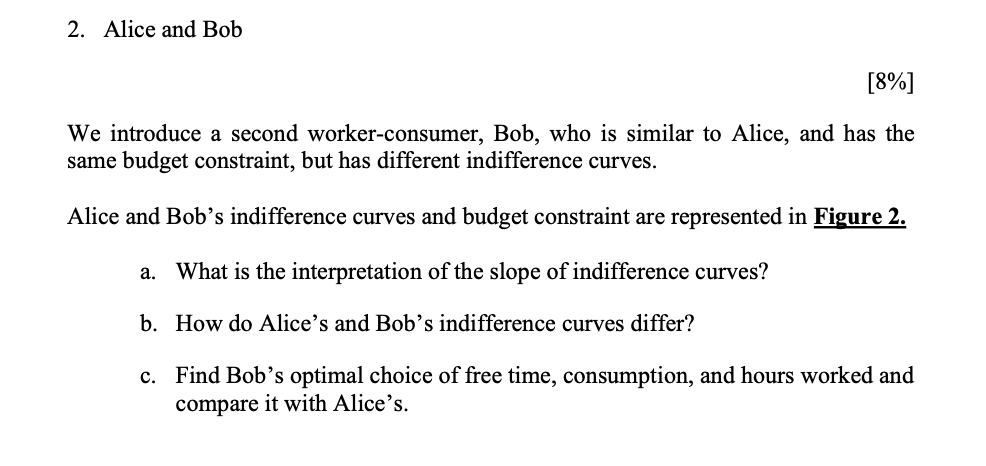
Figure 2 - Alice and Bob's consumption-leisure tradeoff ..... Budget constraint with w=20 wage rate - - Indifference curves Alice - - Indifference curves Bob 4000- 3900 3800 3700 3600 3500 3368 3200 .. . . ..... 3100 3000 2900 2800- 2700 2600 -1-- 2500 2400 2300 92200 $2100 2000 1900 1800 1700 1600 1500 1400 1300 1200 1100 1000 887 800 690 .......... 600 . . .'. . . . . . 500 400 300 200 100 78 8/8 98 108 118 128 138 148 158 168 18 28 38 48 62 68 Weekly free time (hours)2. Alice and Bob [8%] We introduce a second worker-consumer, Bob, who is similar to Alice, and has the same budget constraint, but has different indifference curves. Alice and Bob's indifference curves and budget constraint are represented in Figure 2. a. What is the interpretation of the slope of indifference curves? b. How do Alice's and Bob's indifference curves differ? c. Find Bob's optimal choice of free time, consumption, and hours worked and compare it with Alice's
Step by Step Solution
There are 3 Steps involved in it

Get step-by-step solutions from verified subject matter experts