

Question: Could you please show all work and answer all question's, thank you!! Consider the data in the following Table. Moreover, assume that y _ (
Could you please show all work and answer all question's, thank you!!
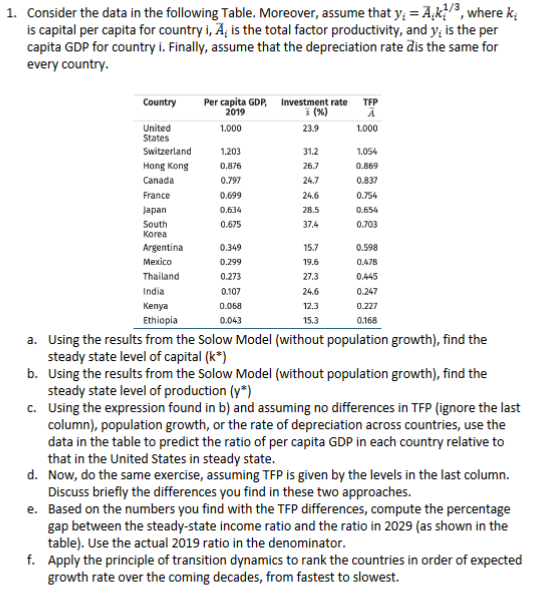
Consider the data in the following Table. Moreover, assume that yi barAiki where ki
is capital per capita for country i barAi is the total factor productivity, and yi is the per
capita GDP for country i Finally, assume that the depreciation rate dis the same for
every country.
a Using the results from the Solow Model without population growth find the
steady state level of capital k
b Using the results from the Solow Model without population growth find the
steady state level of production y
c Using the expression found in b and assuming no differences in TFP ignore the last
column population growth, or the rate of depreciation across countries, use the
data in the table to predict the ratio of per capita GDP in each country relative to
that in the United States in steady state.
d Now, do the same exercise, assuming TFP is given by the levels in the last column.
Discuss briefly the differences you find in these two approaches.
e Based on the numbers you find with the TFP differences, compute the percentage
gap between the steadystate income ratio and the ratio in as shown in the
table Use the actual ratio in the denominator.
f Apply the principle of transition dynamics to rank the countries in order of expected
growth rate over the coming decades, from fastest to slowest.
Step by Step Solution
There are 3 Steps involved in it
1 Expert Approved Answer
Step: 1 Unlock

Question Has Been Solved by an Expert!
Get step-by-step solutions from verified subject matter experts
Step: 2 Unlock
Step: 3 Unlock