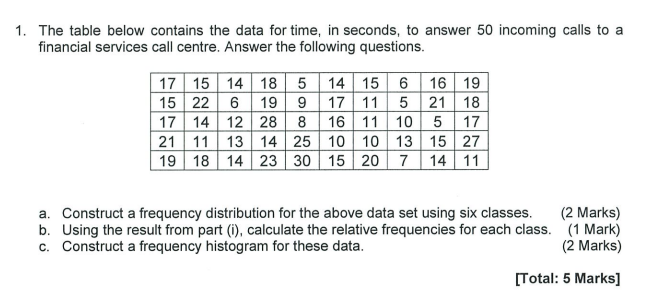
Question: Course: Quantitative Methods Code: BADB1014 Answer all question. 1. The table below contains the data for time, in seconds, to answer 50 incoming calls to

Course: Quantitative Methods

Code: BADB1014

Answer all question.

Course: Quantitative Methods Code: BADB1014Course: Quantitative Methods Code: BADB1014Course: Quantitative Methods Code: BADB1014
1. The table below contains the data for time, in seconds, to answer 50 incoming calls to a financial services call centre. Answer the following questions. 17 15 14 18 5 14 15 6 16 19 15 22 6 19 9 17 11 5 21 18 17 14 12 28 8 16 11 10 5 17 21 11 13 14 25 10 10 13 15 27 19 18 14 23 30 15 20 7 14 11 a. Construct a frequency distribution for the above data set using six classes. (2 Marks) b. Using the result from part (i), calculate the relative frequencies for each class. (1 Mark) c. Construct a frequency histogram for these data. (2 Marks) [Total: 5 Marks]2. Belew is a sample of ten students' seems in a Statistics examination. \"mamm- a. Calculate the mean sears. [1 Mark} b. Find the median and made. [1 Mark} G. Calculate the standard deviation for the sample data. [3 Marks} Fatal: 5 Marks] 3. The following table represents the number of minutes that 20 airline passengers had to wait in order to pass through security along with the frequency in each class. Minutes with Security Number of Passengers 0- 9 4 10 - 19 8 20 - 29 5 30 - 39 3 a. Calculate the mean minutes that a passenger waits to pass through security. (1 Mark) b. Calculate the standard deviation for the data. (3 Marks) [Total: 4 Marks]

Step by Step Solution

There are 3 Steps involved in it

1 Expert Approved Answer
Step: 1 Unlock blur-text-image
Question Has Been Solved by an Expert!

Get step-by-step solutions from verified subject matter experts

Step: 2 Unlock
Step: 3 Unlock

Students Have Also Explored These Related Mathematics Questions!