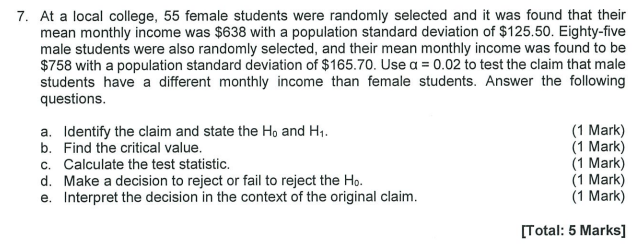
Question: Course: Quantitative Methods Code: BADB1014 Answer all questions. 7. At a local college, 55 female students were randomly selected and it was found that their

Course: Quantitative Methods

Code: BADB1014

Answer all questions.

Course: Quantitative Methods Code: BADB1014Course: Quantitative Methods Code: BADB1014Course: Quantitative Methods Code: BADB1014
7. At a local college, 55 female students were randomly selected and it was found that their mean monthly income was $638 with a population standard deviation of $125.50. Eighty-five male students were also randomly selected, and their mean monthly income was found to be $758 with a population standard deviation of $165.70. Use a = 0.02 to test the claim that male students have a different monthly income than female students. Answer the following questions. a. Identify the claim and state the Ho and H1. (1 Mark) b. Find the critical value. (1 Mark) c. Calculate the test statistic. (1 Mark) d. Make a decision to reject or fail to reject the Ho. (1 Mark) e. Interpret the decision in the context of the original claim. (1 Mark) [Total: 5 Marks]8. In a study of the effectiveness of diet on weight loss, 20 people were randomly selected to participate in a diet program for 30 days. Test the claim that diet had an impact on weight loss. Use a = 0.02. Assume that the distribution is normally distributed. Answer the following questions. Participant A B C D E F G H Weight before program (in kg) 81 95 71 85 88 102 86 75 76 91 Weight after 83 program (in kg) 93 71 86 83 100 89 70 75 91 Participant K L M N O P Q R S T Weight before program (in kg) 85 78 75 84 102 66 95 97 67 79 (continued) Weight after program (in kg) 81 79 74 85 109 63 92 92 65 79 (continued) a. Identify the claim and state the Ho and H1. (1 Mark) b. Find the critical value. (1 Mark) c. Calculate the test statistic. (3 Marks) d. Make a decision to reject or fail to reject the Ho. (1 Mark) e. Interpret the decision in the context of the original claim. (1 Mark) [Total: 7 Marks]9. A candy bar manufacturer is interested in trying to estimate how sales are influenced by the price of their product. To do this, the company randomly chooses 6 small cities and offers the candy bar at different prices. Using candy bar sales as the dependent variable, the company conducted a simple linear regression. Answer the questions based on the statistical output. Answer the questions based on the statistical output. Model Summary Model R R Square Adjusted R Std. Error of the Square Estimate 1 0.885 0.784 0.730 16.299 a. Predictors: (Constant), Income b. Dependent Variable: Sales (RM) Coefficients Unstandardized Std. Error Model Coefficients # p-value B (Constant) 161.39 26.16 6.17 0.004 Income -48. 19 12.65 -3.81 0.019 a. Predictors: (Constant), Income b. Dependent Variable: Sales(RM) a. What is the value of the coefficient of correlation? Explain this value in relation to the problem. (1 Mark) b. Use 5% significance level to test that there is a significant relationship in the population between PRICE and SALES. (1 Mark) c. Write the regression equation for this problem from the output? (1 Mark) d. Predict the SALES if the PRICE is RM2.35. (1 Mark) [Total: 4 Marks]

Step by Step Solution

There are 3 Steps involved in it

1 Expert Approved Answer
Step: 1 Unlock blur-text-image
Question Has Been Solved by an Expert!

Get step-by-step solutions from verified subject matter experts

Step: 2 Unlock
Step: 3 Unlock

Students Have Also Explored These Related Mathematics Questions!