

Question: course.work X + -> C course.work/#!/students/61cddcdb6caaab00169e31e7/do G course.work My Account Student Log Out C Let's continue exploring Academy Award Nominees for Best Picture. The data

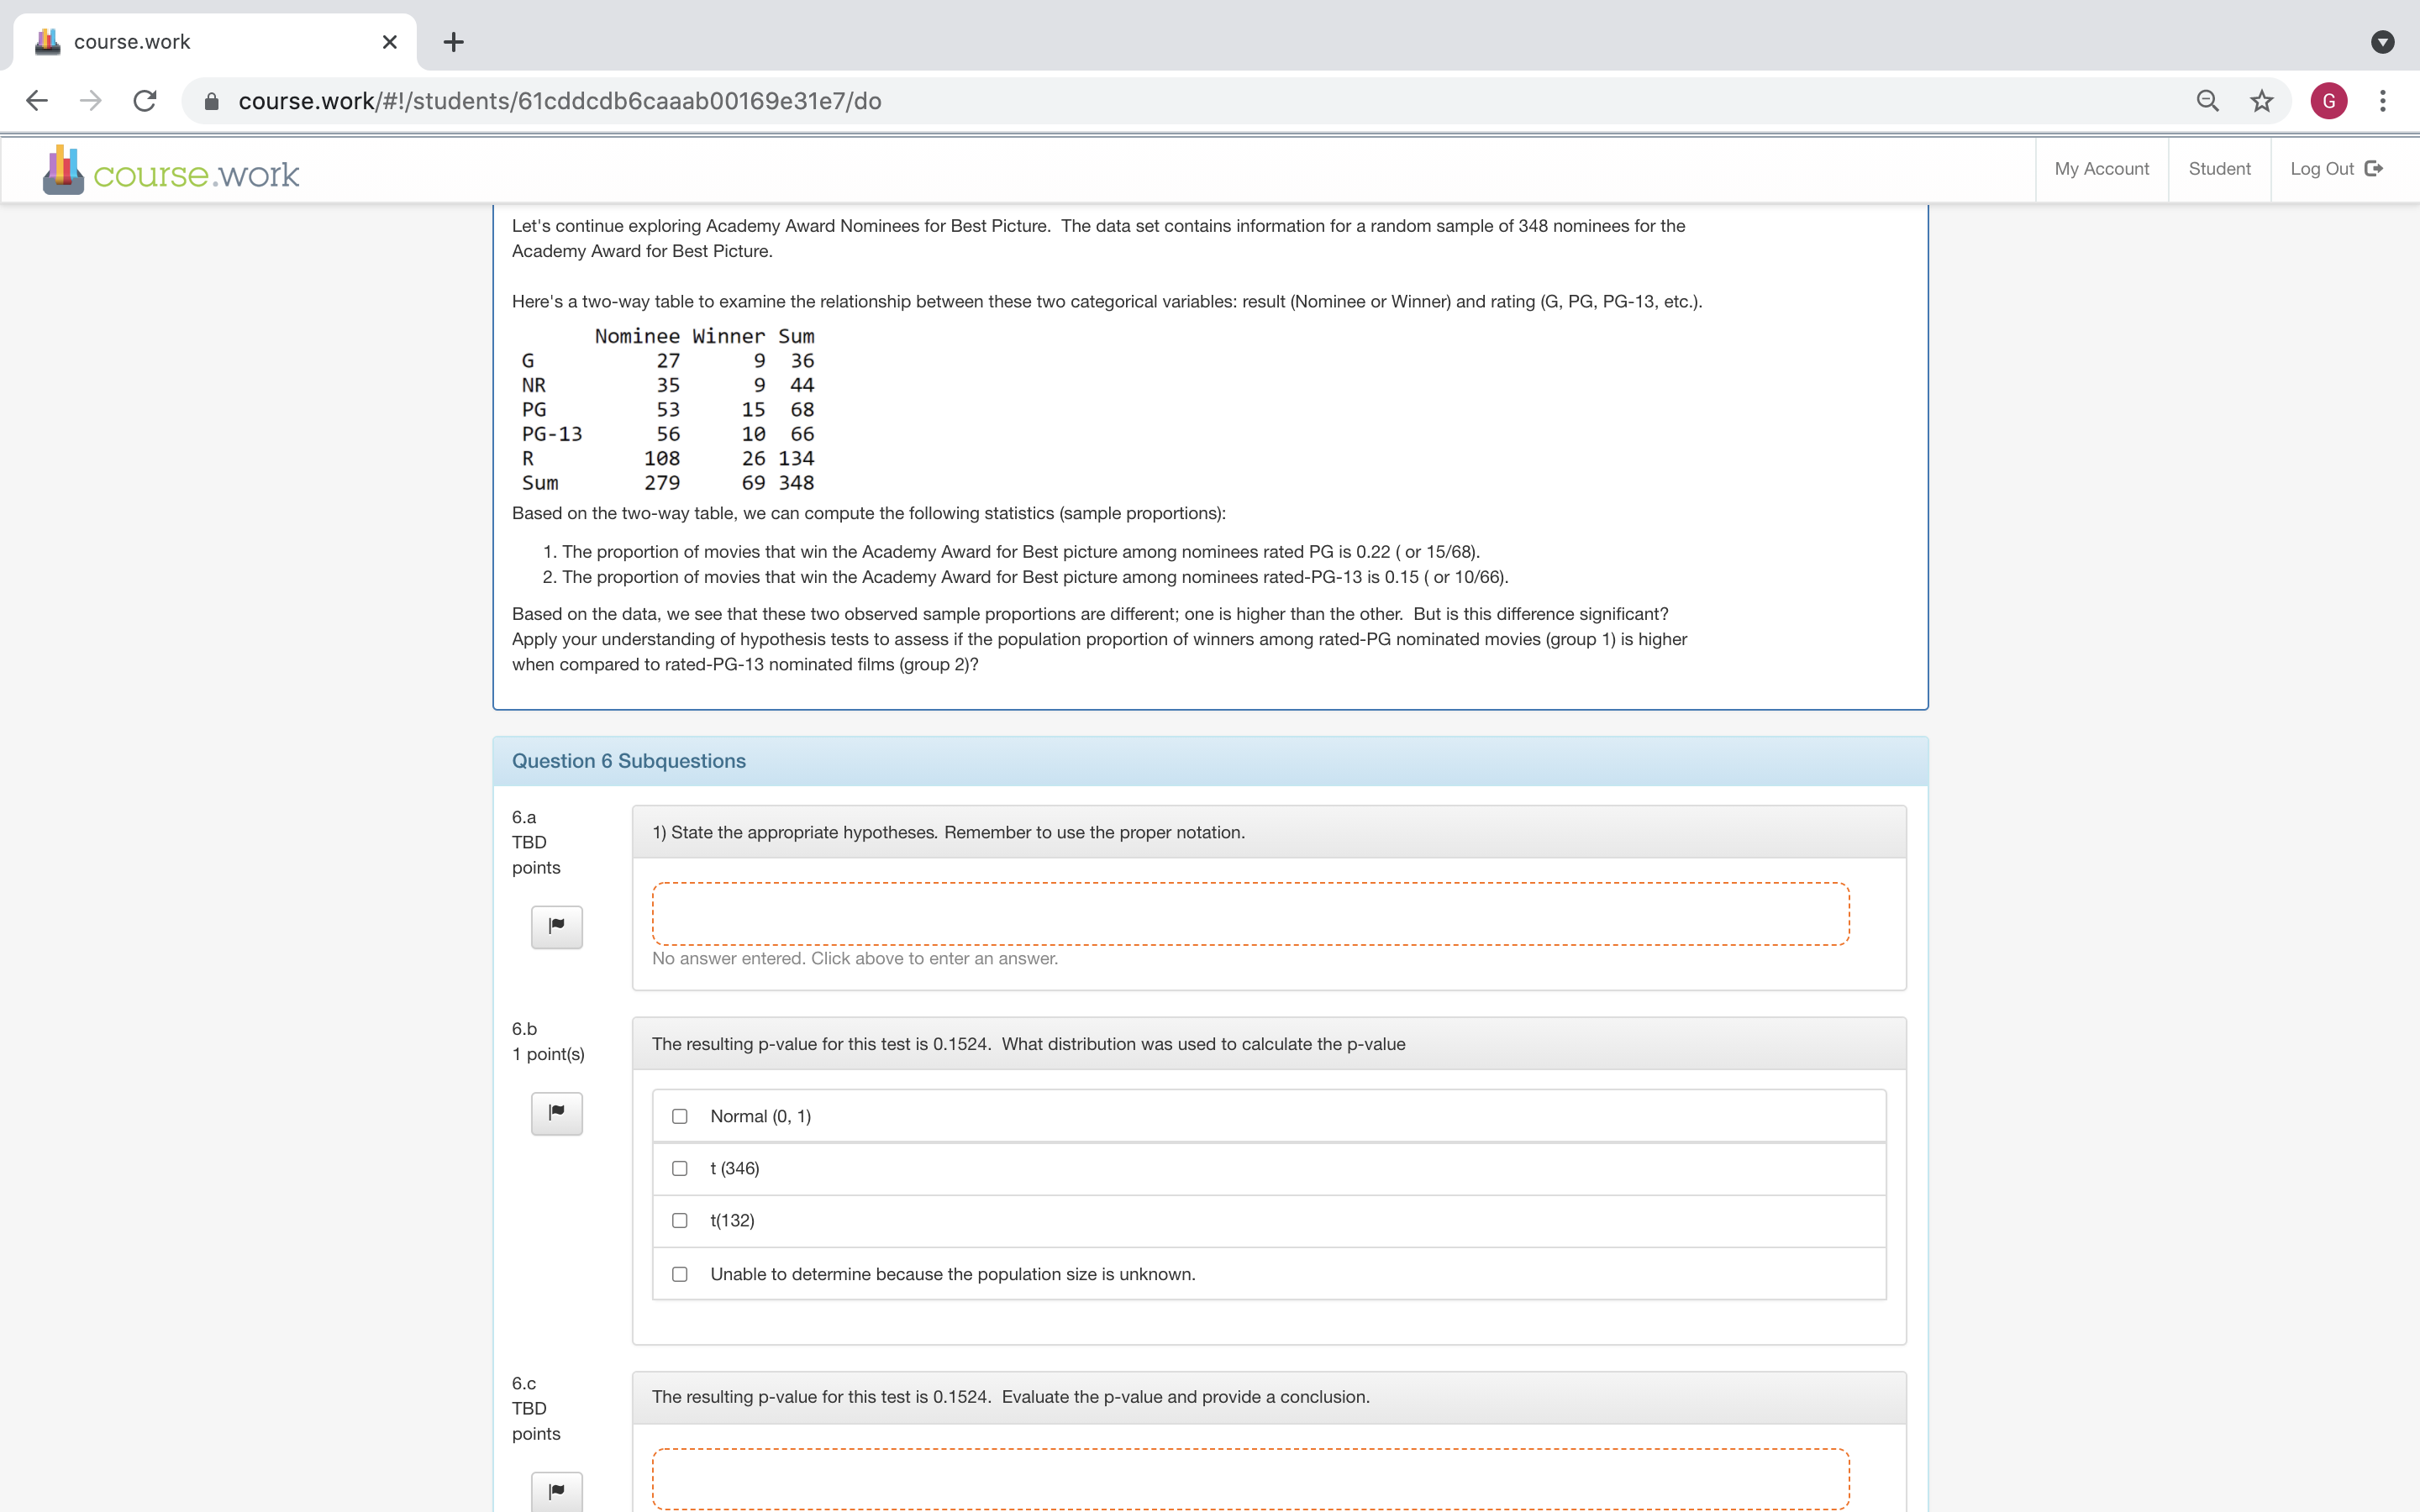
course.work X + -> C course.work/#!/students/61cddcdb6caaab00169e31e7/do G course.work My Account Student Log Out C Let's continue exploring Academy Award Nominees for Best Picture. The data set contains information for a random sample of 348 nominees for the Academy Award for Best Picture. Here's a two-way table to examine the relationship between these two categorical variables: result (Nominee or Winner) and rating (G, PG, PG-13, etc.). Nominee Winner Sum G 27 9 36 NR 35 9 44 PG 53 15 68 PG-13 56 10 66 R 108 26 134 Sum 279 69 348 Based on the two-way table, we can compute the following statistics (sample proportions): 1. The proportion of movies that win the Academy Award for Best picture among nominees rated PG is 0.22 ( or 15/68). 2. The proportion of movies that win the Academy Award for Best picture among nominees rated-PG-13 is 0.15 ( or 10/66). Based on the data, we see that these two observed sample proportions are different; one is higher than the other. But is this difference significant? Apply your understanding of hypothesis tests to assess if the population proportion of winners among rated-PG nominated movies (group 1) is higher when compared to rated-PG-13 nominated films (group 2)? Question 6 Subquestions 6.a TBD 1) State the appropriate hypotheses. Remember to use the proper notation. oints No answer entered. Click above to enter an answer. 6.b 1 point(s) The resulting p-value for this test is 0.1524. What distribution was used to calculate the p-value Normal (0, 1) O t(346) O t(132 Unable to determine because the population size is unknown. 6.C TBD The resulting p-value for this test is 0.1524. Evaluate the p-value and provide a conclusion. points
Step by Step Solution
There are 3 Steps involved in it

Get step-by-step solutions from verified subject matter experts