

Question: Let's continue exploring the movies data set from your first MWrite assignment. Recall that this data set contains information for a random sample of nominees
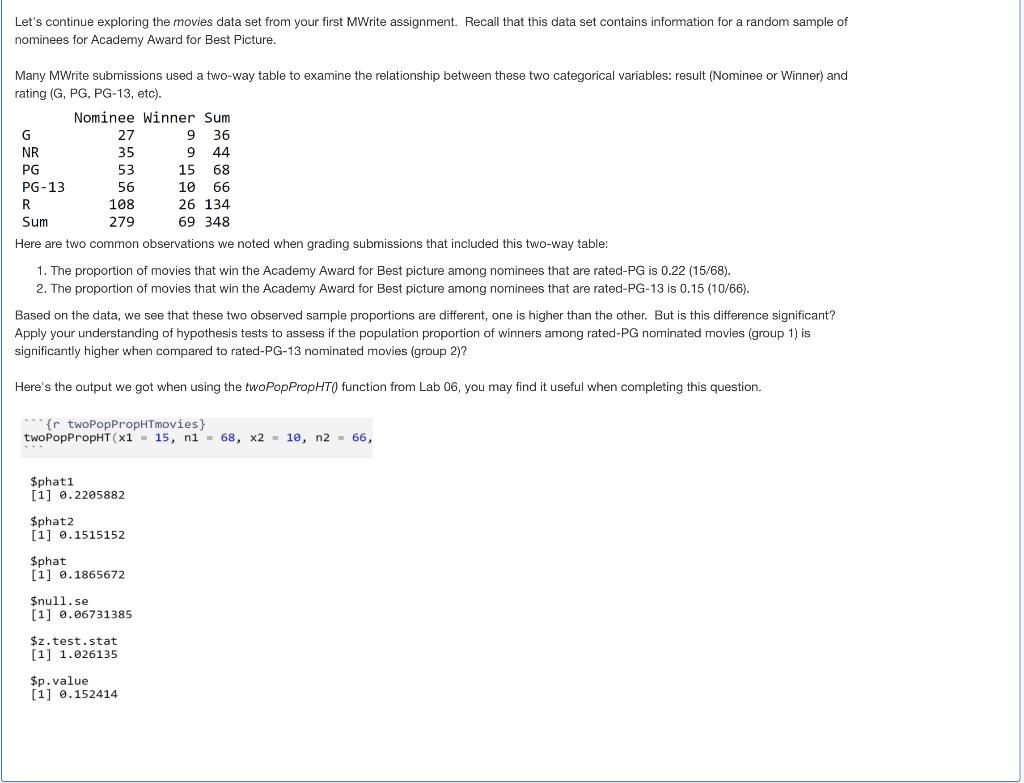

Let's continue exploring the movies data set from your first MWrite assignment. Recall that this data set contains information for a random sample of nominees for Academy Award for Best Picture, Many MWrite submissions used a two-way table to examine the relationship between these two categorical variables: result (Nominee or Winner) and rating (G, PG, PG-13, etc). Nominee Winner Sum G 27 9 36 NR 35 9 44 PG 53 15 68 PG-13 56 10 66 R 108 26 134 Sum 279 69 348 Here are two common observations we noted when grading submissions that included this two-way table: 1. The proportion of movies that win the Academy Award for Best picture among nominees that are rated-PG is 0.22 (15/68). 2. The proportion of movies that win the Academy Award for Best picture among nominees that are rated-PG-13 is 0.15 (10/66). Based on the data, we see that these two observed sample proportions are different, one is higher than the other. But is this difference significant? Apply your understanding of hypothesis tests to assess if the population proportion of winners among rated-PG nominated movies (group 1) is significantly higher when compared to rated-PG-13 nominated movies (group 2)? Here's the output we got when using the twoPopPropHT() function from Lab 06, you may find it useful when completing this question. ***{r twoPopPropHTmovies} twoPopProphT (x1 - 15, n1 = 68, x2 = 10, n2 = 66, $phat1 [1] 0.2205882 $phat2 [1] 0.1515152 Sphat [1] 0.1865672 $null.se [1] 6.06731385 $z. test. stat [1] 1.026135 $p.value [1] 0.152414 8.a TBD points 1) State the appropriate hypotheses (the significance level has been selected to be 10%). Remember to use the proper notation. BIU x , IX := Font Size A. A 1 No answer entered. Click above to enter an answer. Saved 8.b TBD points 2) Check the necessary assumption(s) (you may assume that you have two independent random samples). BI U xx I. 22 Font Size A- A- 1 No answer entered. Click above to enter an answer. Saved 8.C TBD points At this point in doing your homework, your friend, Randy, who has not taken a statistics course, looks over at your work, and sees the large positive difference (0.22-0.15) in the sample proportions of winners among rated-PG and rated-PG-13 nominated movies for the Academy Award. He wants to know if this is true in general, that is, if the proportion of rated-PG nominated movies that win an Academy Award is higher than that for rated-PG-13 nominated movies? You tell him this is exactly what you are working on. You will be explaining to Randy how your hypothesis test helps answer his question. Let's start by walking Randy through the process of conducting a hypothesis test. 1. First, describe to Randy that when conducting a hypothesis test, we have two competing ideas about a quantity that is unknown to us. One of these ideas proposes that there is no difference in population proportion of winners of an Academy Award between rated PG nominated movies and rated PG-13 nominated movies. This is called the null hypothesis. 2. Second, we have Randy's question of interest, whether the proportion of rated-PG nominated movies that win an Academy Award is higher than that for rated-PG-13 nominated movies, which is expressed in the alternative hypothesis. 3. Now it is your turn to continue this explanation. Clarity in two or three sentences how the null hypothesis of no difference is used to understand whether the observed difference of 0.07 is unusual or not. Your explanation should include the idea of probability and relevent values from the output. BIU x x TXEE Font - Size A No answer entered. Click above to enter an answer. Saved 8.d TBD points Now, explain to Randy the result of your hypothesis test by evaluating the p-value and providing a statement of the conclusion. B IU x x, TX = r Font Size A
Step by Step Solution
There are 3 Steps involved in it

Get step-by-step solutions from verified subject matter experts