

Question: Crash Costs Table Activity A B Preceedin g Activity None A Normal Duration 2 Normal Cost 150 Crash Max Crash cost/Slope 1 100 1 80
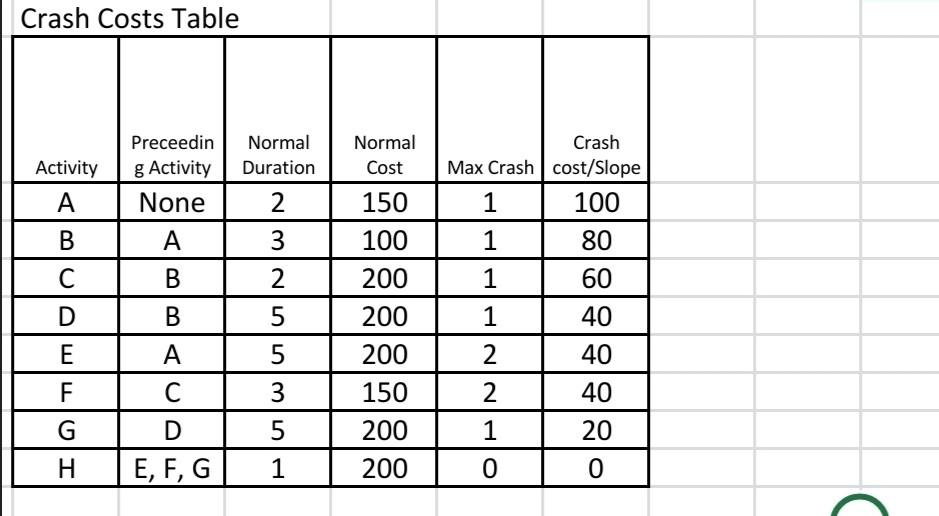
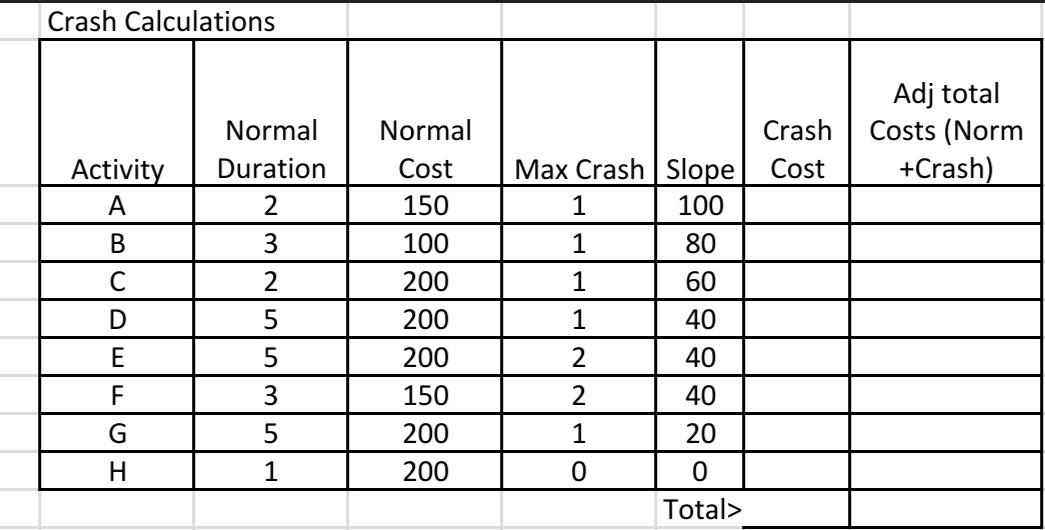
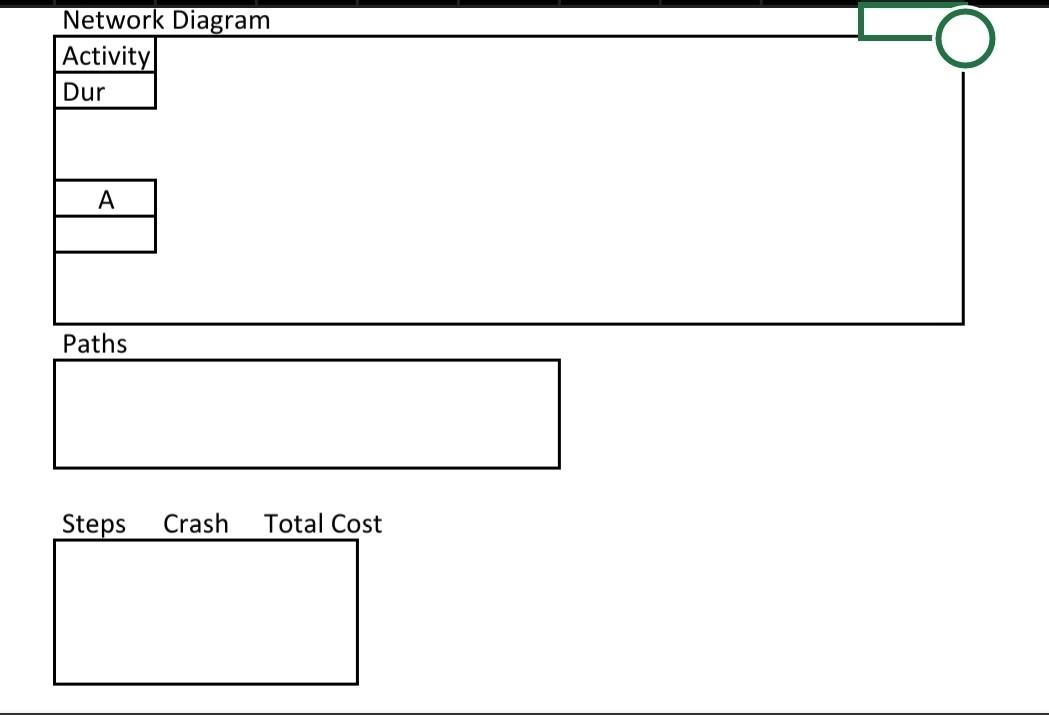
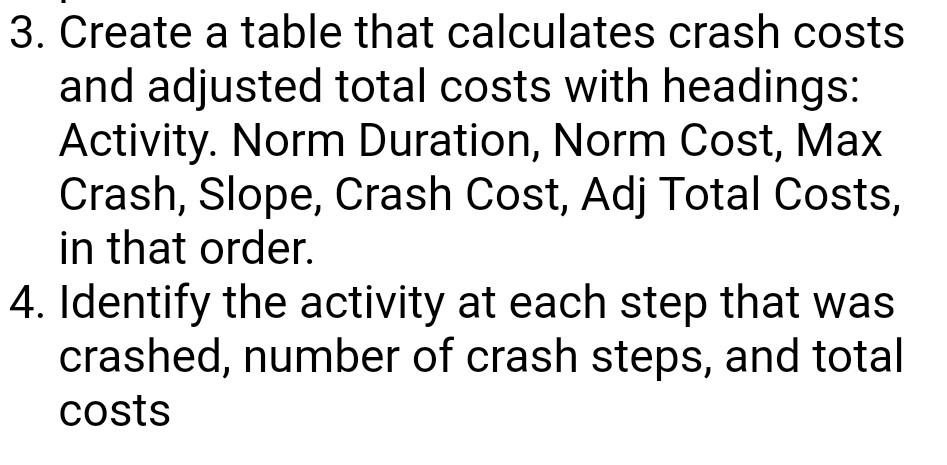
Crash Costs Table Activity A B Preceedin g Activity None A Normal Duration 2 Normal Cost 150 Crash Max Crash cost/Slope 1 100 1 80 3 100 C B 2 200 1 60 D | | U[ U DWU B 5 1 40 40 E 2 A C F 3 200 200 150 200 200 |TIG NINA OP 2 D 5 1 40 20 0 H E, F, G 1 0 Crash Calculations Normal Duration 2 Normal Cost 150 Crash Cost Activity A Adj total Costs (Norm +Crash) Max Crash Slope 1 100 3 100 1 B C 2 200 1 80 60 40 D 5 200 1 E 5 200 2 40 F 3 150 2 40 G 5 200 1 20 H 1 200 0 0 Total> Network Diagram Activity Dur A Paths Steps Crash Total Cost 3. Create a table that calculates crash costs and adjusted total costs with headings: Activity. Norm Duration, Norm Cost, Max Crash, Slope, Crash Cost, Adj Total Costs, in that order. 4. Identify the activity at each step that was crashed, number of crash steps, and total costs
Step by Step Solution
There are 3 Steps involved in it
1 Expert Approved Answer
Step: 1 Unlock

Question Has Been Solved by an Expert!
Get step-by-step solutions from verified subject matter experts
Step: 2 Unlock
Step: 3 Unlock