

Question: creat the pie chart and monthly interest rate table using the information from the spreadsheet C A B 1 Total Spending 2 Grand Total 3
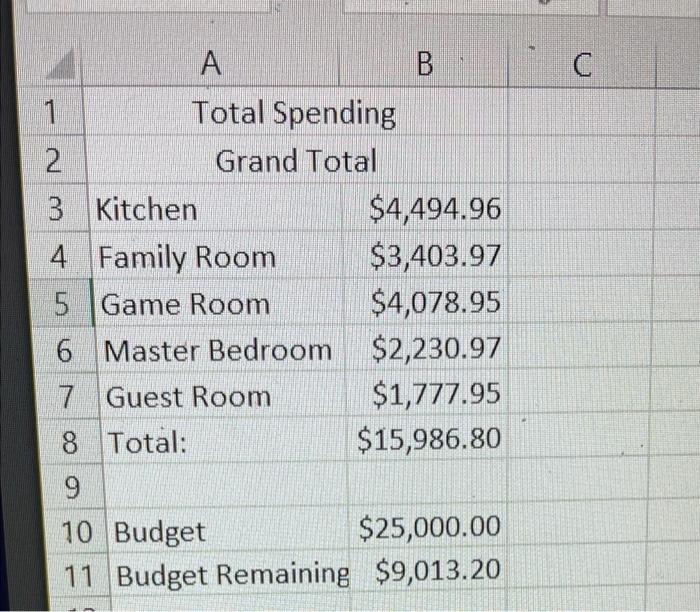
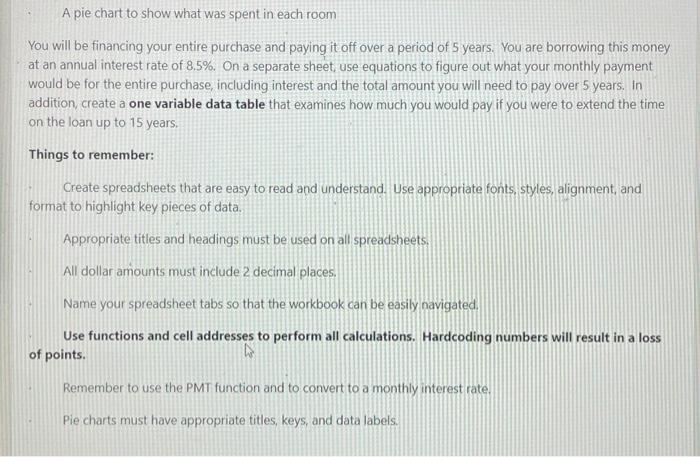
C A B 1 Total Spending 2 Grand Total 3 Kitchen $4,494.96 4 Family Room $3,403.97 5 Game Room $4,078.95 6 Master Bedroom $2,230.97 7 Guest Room $1,777.95 8 Total: $15,986.80 9 10 Budget $25,000.00 11 Budget Remaining $9,013.20 A pie chart to show what was spent in each room You will be financing your entire purchase and paying it off over a period of 5 years. You are borrowing this money at an annual interest rate of 8.5%. On a separate sheet, use equations to figure out what your monthly payment would be for the entire purchase, including interest and the total amount you will need to pay over 5 years. In addition, create a one variable data table that examines how much you would pay if you were to extend the time on the loan up to 15 years. Things to remember: Create spreadsheets that are easy to read and understand. Use appropriate fonts, styles, alignment, and format to highlight key pieces of data. Appropriate titles and headings must be used on all spreadsheets. All dollar amounts must include 2 decimal places, Name your spreadsheet tabs so that the workbook can be easily navigated. Use functions and cell addresses to perform all calculations. Hardcoding numbers will result in a loss of points. Remember to use the PMT function and to convert to a monthly interest rate Pie charts must have appropriate titles, keys, and data labels
Step by Step Solution
There are 3 Steps involved in it

Get step-by-step solutions from verified subject matter experts