

Question: Create a boxplot for each variable separately. 1 I - - 2 Country Years of Schooling Life Expectancy 3 1 10.1 65 4 2 14.2
Create a boxplot for each variable separately.
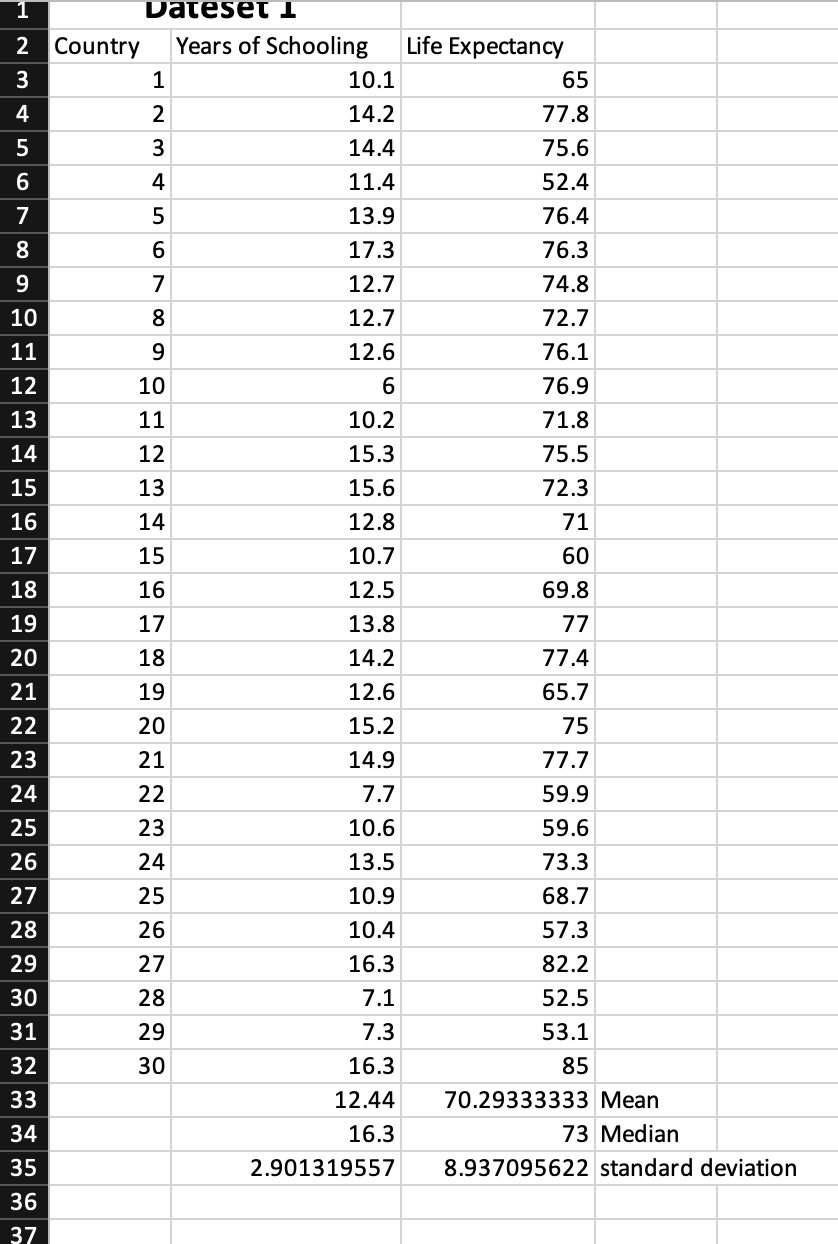
1 I - - 2 Country Years of Schooling Life Expectancy 3 1 10.1 65 4 2 14.2 77.8 5 3 14.4 75.6 6 4 11.4 52.4 7 5 13.9 76.4 8 6 17.3 76.3 9 7 12.7 74.8 10 8 12.7 72.7 11 9 12.6 76.1 12 10 6 76.9 13 11 10.2 71.8 14 12 15.3 75.5 15 13 15.6 72.3 16 14 12.8 71 17 15 10.7 60 18 16 12.5 69.8 19 17 13.8 77 20 18 14.2 77.4 21 19 12.6 65.7 22 20 15.2 75 23 21 14.9 77.7 24 22 7.7 59.9 25 23 10.6 59.6 26 24 13.5 73.3 27 25 10.9 68.7 28 26 10.4 57.3 29 27 16.3 82.2 30 28 7.1 52.5 31 29 7.3 53.1 32 30 16.3 85 33 12.44 70.29333333 Mean 34 16.3 73 Median 35 2.901319557 8.937095622 standard deviation U.) (TI
Step by Step Solution
There are 3 Steps involved in it

Get step-by-step solutions from verified subject matter experts