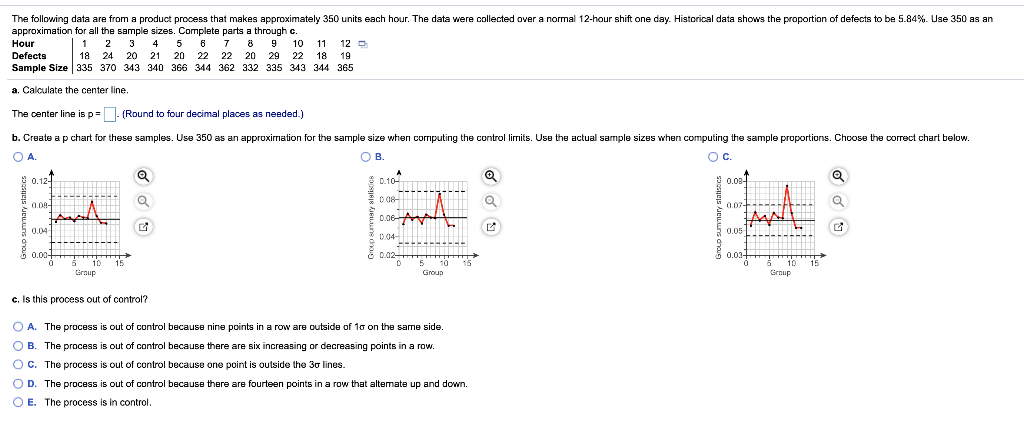
Question: The following data are from a product process that makes approximately 350 units each hour. The data were collected over a normal 12-hour shift one

The following data are from a product process

The following data are from a product process that makes approximately 350 units each hour. The data were collected over a normal 12-hour shift one day. Historical data shows the proportion of defects to be 5.84%. Use 350 as an approximation for all the sample sizes. Complete parts a through c. Hour 1 2 3 4 5 6 7 8 9 10 11 12 Defects 18 24 20 21 20 22 22 20 29 22 18 19 Sample Size 335 370 343 340 366 344 362 332 335 343 344 365 a. Calculate the center line. The center line is p= (Round to four decimal places as needed.) b. Create a p chart for these samples. Use 350 as an approximation for the sample size when computing the control limits. Use the actual sample sizes when computing the sample proportions. Choose the correct chart below. OA. OC. $0.127 8 0.097 0.07+ Group summary statistics Group Sunary statistics Group summary statistics $ 0.04 10 15 45 Group Group c. Is this process out of control? O A. The process is out of control because nine points in a row are outside of 16 on the same side. OB. The process is out of control because there are six increasing or decreasing points in a row. OC. The process is out of control because one point is outside the 3o linos. OD. The process is out of control because there are fourteen points in a row that alternate up and down. O E. The process is in control

Step by Step Solution

There are 3 Steps involved in it

1 Expert Approved Answer
Step: 1 Unlock blur-text-image
Question Has Been Solved by an Expert!

Get step-by-step solutions from verified subject matter experts

Step: 2 Unlock
Step: 3 Unlock

Students Have Also Explored These Related General Management Questions!