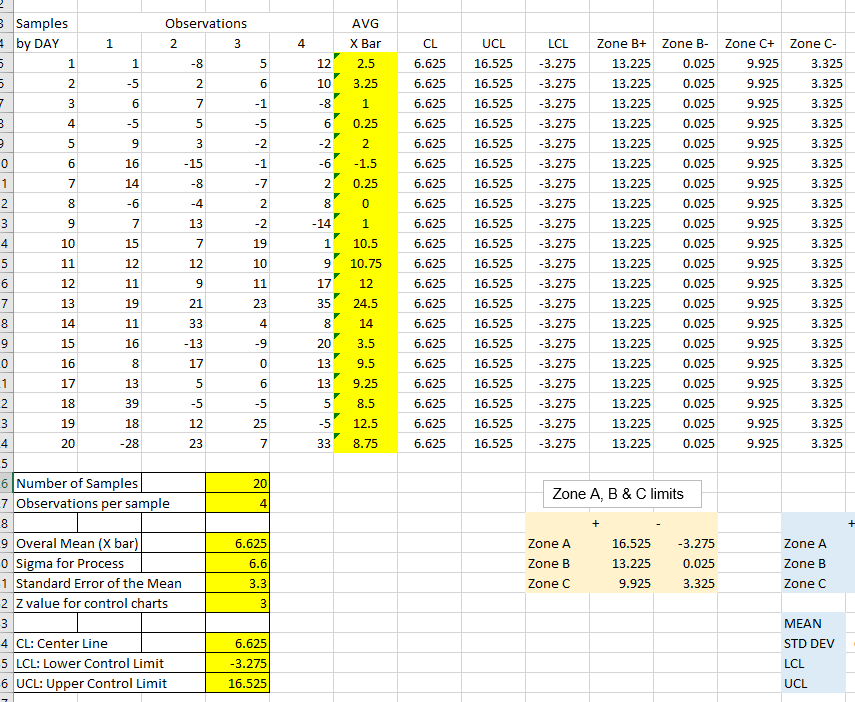
Question: Create a Control Chart for this data. Provide an appropriate graph title & series labels (legend) & graph annotations (to identify CL, UCL & LCL

Create a Control Chart for this data. Provide an appropriate graph title & series labels (legend)

& graph annotations (to identify CL, UCL & LCL lines).

HERE IS THE DATA=

Create a Control Chart for this data. Provide an

AVG 2 3 4 CL UCL Zone C+ X Bar 2.5 LCL -3.275 Zone C- 3.325 12 6.625 16.525 16.525 9.925 9.925 10 3.25 -3.275 3.325 a -8 1 16.525 -3.275 9.925 3.325 3.325 6 0.25 16.525 -3.275 Zone B- 0.025 0.025 0.025 0.025 0.025 0.025 0.025 0.025 9.925 -2 2 16.525 Zone B+ 13.225 13.225 13.225 13.225 13.225 13.225 13.225 13.225 13.225 13.225 -3.275 9.925 3.325 3.325 -6 -1.5 16.525 -3.275 9.925 2 16.525 -3.275 9.925 0.25 0 3.325 3.325 N 8 16.525 9.925 Nm -14 1 16.525 0.025 9.925 3.325 3.325 1 10.5 -3.275 -3.275 -3.275 -3.275 -3.275 0.025 9.925 16.525 16.525 9 6.625 6.625 6.625 6.625 6.625 6.625 6.625 6.625 6.625 6.625 6.625 6.625 6.625 6.625 6.625 6.625 6.625 6.625 6.625 10.75 13.225 0.025 9.925 3.325 17 12 16.525 9.925 3.325 13.225 13.225 35 16.525 9.925 3.325 24.5 14 -3.275 -3.275 8 16.525 9.925 3.325 13.225 13.225 20 3.5 16.525 9.925 3 Samples Observations 2 by DAY 1 2 3 5 1 1 -8 5 5 2 -5 2 6 7 3 7 -1 3 4 -5 5 -5 2 5 9 3 -2 0 6 16 - 15 -1 1 7 14 -8 -7 2 8 -6 -4 3 9 7 13 -2 4 10 15 7 19 5 11 12 12 10 6 12 11 9 11 7 13 19 21 23 8 14 11 33 4 9 15 16 -13 -9 0 16 8 17 0 1 17 13 5 6 2 18 39 -5 -5 3 19 18 12 25 4 20 -28 23 7 5 6 Number of Samples 20 7 Observations per sample 4 8 9 Overal Mean (X bar) 6.625 o Sigma for Process 6.6 1 Standard Error of the Mean 3.3 2 Z value for control charts 3 3 4 CL: Center Line 6.625 5 LCL: Lower Control Limit -3.275 6 UCL: Upper Control Limit 16.525 3.325 13 9.5 16.525 9.925 0.025 0.025 0.025 0.025 0.025 0.025 0.025 0.025 0.025 13.225 13.225 3.325 13 9.25 16.525 9.925 -3.275 -3.275 -3.275 -3.275 -3.275 -3.275 3.325 5 8.5 16.525 9.925 3.325 -5 12.5 16.525 13.225 13.225 13.225 9.925 3.325 3.325 33 8.75 16.525 9.925 Zone A, B & C limits + -3.275 Zone A Zone B Zone C 16.525 13.225 0.025 3.325 Zone A Zone B Zone C 9.925 MEAN STD DE LCL UCL

Step by Step Solution

There are 3 Steps involved in it

1 Expert Approved Answer
Step: 1 Unlock blur-text-image
Question Has Been Solved by an Expert!

Get step-by-step solutions from verified subject matter experts

Step: 2 Unlock
Step: 3 Unlock

Students Have Also Explored These Related General Management Questions!