

Question: Create a dashboard containing the following three charts. a . Create a horizontal bar chart of US Clothing Store Sales from 2 0 0 7
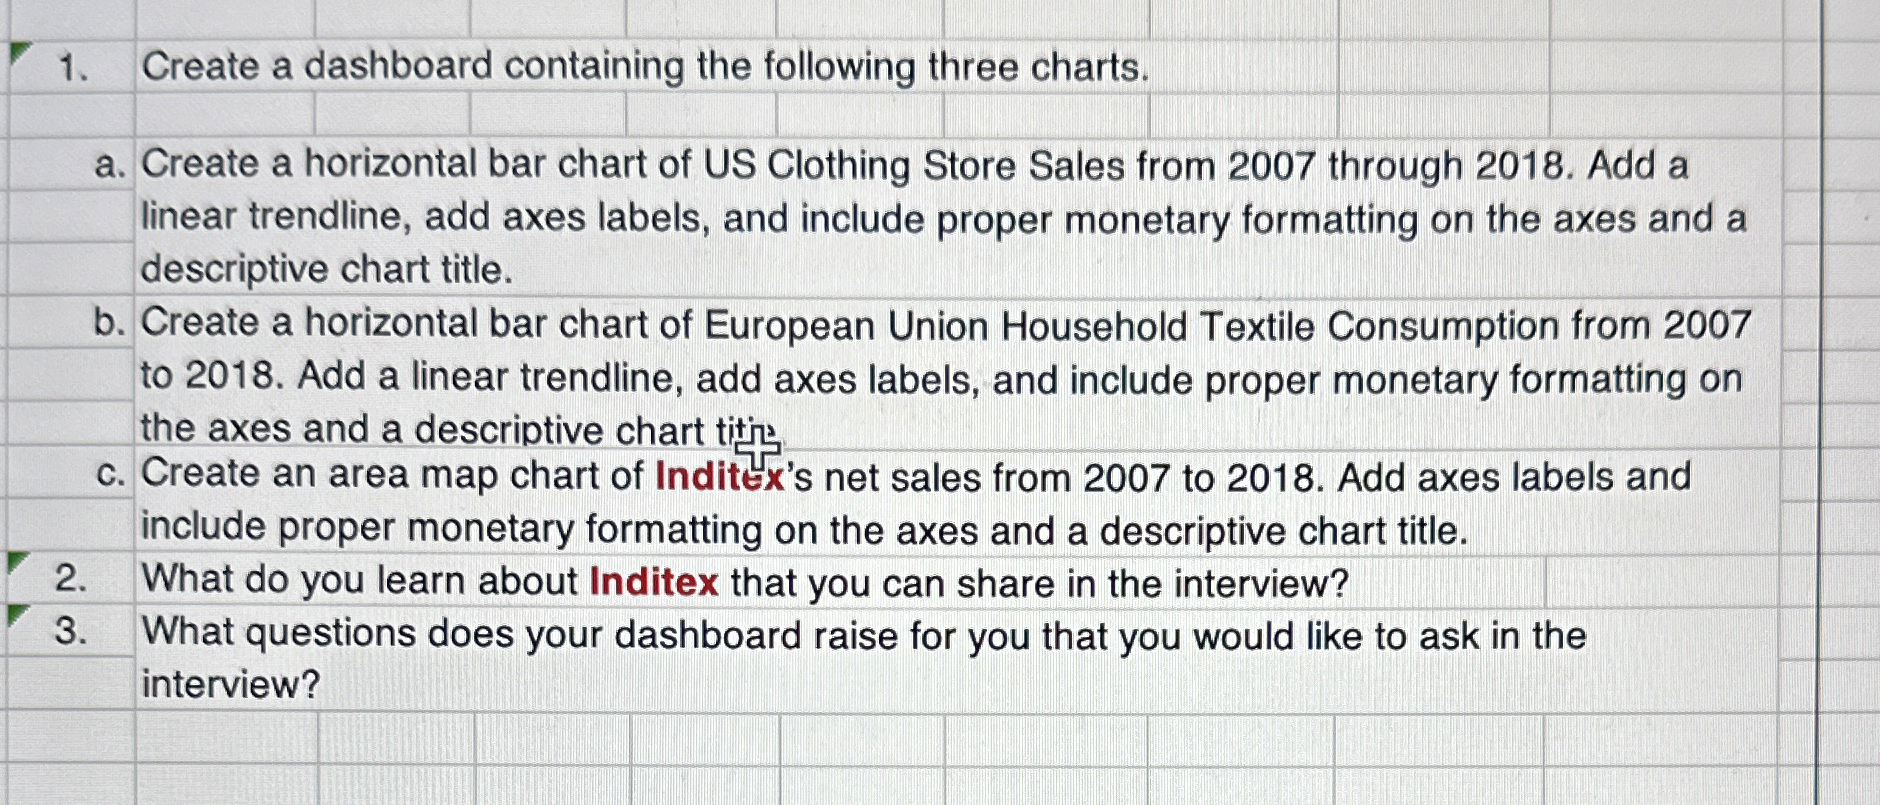
Create a dashboard containing the following three charts.
a Create a horizontal bar chart of US Clothing Store Sales from through Add a linear trendline, add axes labels, and include proper monetary formatting on the axes and a descriptive chart title.
b Create a horizontal bar chart of European Union Household Textile Consumption from to Add a linear trendline, add axes labels, and include proper monetary formatting on the axes and a descriptive chart titis:
c Create an area map chart of Inditex's net sales from to Add axes labels and include proper monetary formatting on the axes and a descriptive chart title.
What do you learn about Inditex that you can share in the interview?
What questions does your dashboard raise for you that you would like to ask in the interview?
Step by Step Solution
There are 3 Steps involved in it
1 Expert Approved Answer
Step: 1 Unlock

Question Has Been Solved by an Expert!
Get step-by-step solutions from verified subject matter experts
Step: 2 Unlock
Step: 3 Unlock