

Question: Create a demand curve from a data demand schedule (provided) and use demand curve to calculate price point elasticity of demand. See Appendix C for
Create a demand curve from a data demand schedule (provided) and use demand curve to calculate price point elasticity of demand. See Appendix C for the data set. Interpret the results. Copy and paste figures into word document and follow the APA styles guide.
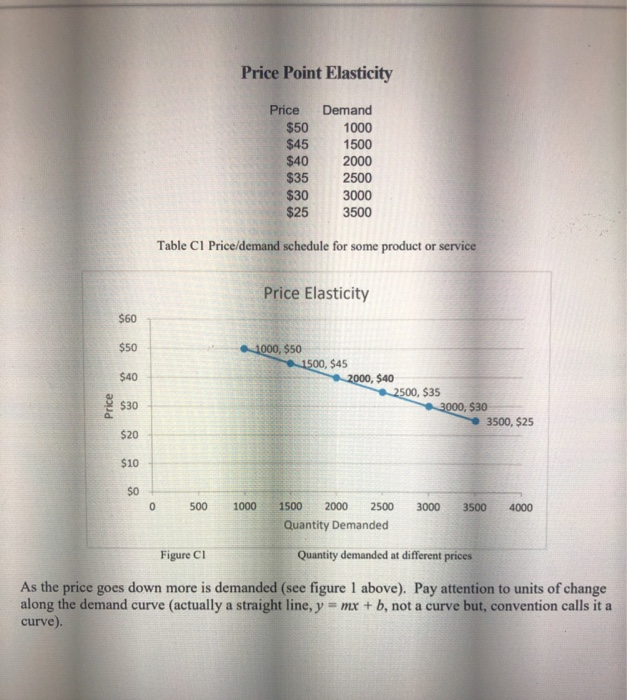
Price Point Elasticity Price $50 $45 $40 $35 $30 $25 Demand 1000 1500 2000 2500 3000 3500 Table Cl Price/demand schedule for some product or service Price Elasticity $60 $50 1000, $50 1500, $45 $40 2000, $40 2500, $35 $30 3000, $30 3500, $25 $20 $10 $0 500 1000 1500 2000 2500 3000 3500 4000 Quantity Demanded Figure CI Quantity demanded at different prices As the price goes down more is demanded (see figure 1 above). Pay attention to units of change along the demand curve (actually a straight line, y = mx + b, not a curve but, convention calls it a curve). Price
Step by Step Solution
3.42 Rating (152 Votes )
There are 3 Steps involved in it
The point elasticity of a demand curve is the ratio of percentage change in quantity demanded to the ... View full answer

Get step-by-step solutions from verified subject matter experts