

Question: Create a financial analysis based on the tables attached for GoodLife Gyms. 326 Part 3: Strategic Marketing EXHIBIT 3 Kitchener GoodLife Club-Membership by Month Month
Create a financial analysis based on the tables attached for GoodLife Gyms.
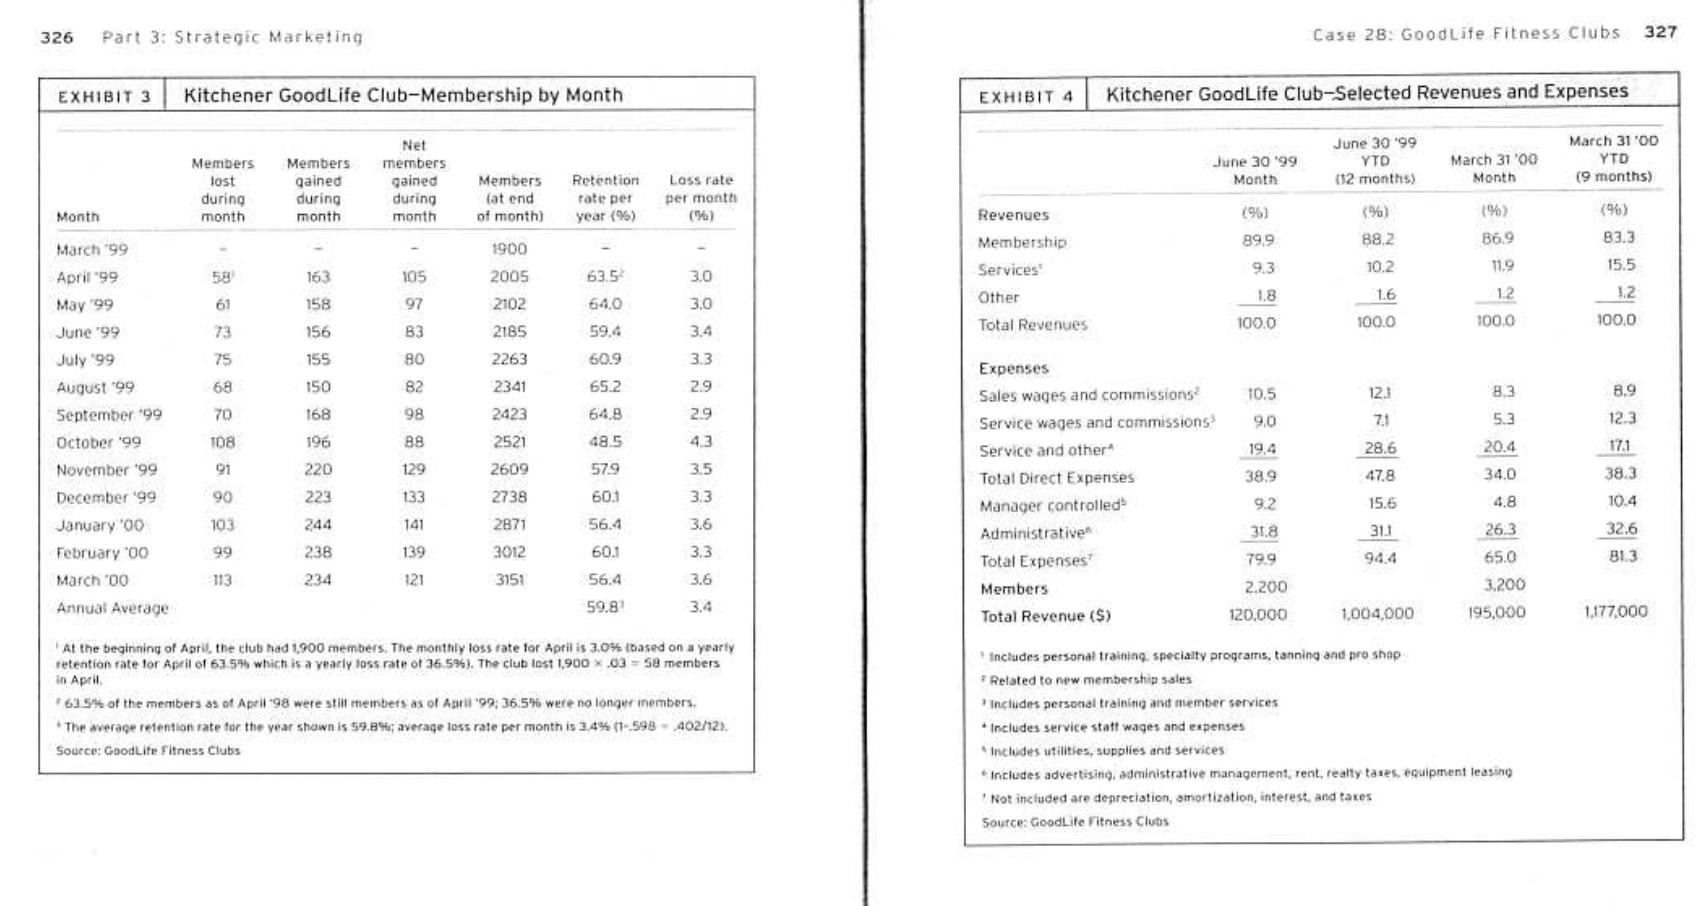
326 Part 3: Strategic Marketing EXHIBIT 3 Kitchener GoodLife Club-Membership by Month Month March 199 April 99 May '99 June '99 July '99 August 99 September 199 October '99 November '99 December 99 January '00 February '00 March 200 Annual Average Members lost during month 61 75 68 70 108 91 90 103 99 113 Members gained during month 163 158 156 155 150 168 196 220 223 244 238 234 Net members gained during month 105 97 83 80 82 98 88 129 133 141 139 121 Members Retention (at end rate per of month) year (%) 1900 2005 2102 2185 2263 2341 2423 2521 2609 2738 2871 3012 3151 63.5 64.0 59.4 60.9 65.2 64.8 48.5 57.9 601 56.4 601 56.4 59.8 Loss rate per month (%) 3.0 3.0 3.4 3.3 2.9 2.9 3.5 3.3 3.6 3.3 3.6 3.4 At the beginning of April, the club had 1,900 members. The monthly loss rate for April is 3.0% (based on a yearly retention rate for April of 63.5% which is a yearly loss rate of 36.5%). The club lost 1,900 x .0358 members in April, *63.5% of the members as of April 98 were still members as of April '99; 36.5% were no longer members. The average retention rate for the year shown is $59.8%; average loss rate per month is 3.4% (1-598-402/12). Source: GoodLife Fitness Clubs EXHIBIT 4 Revenues Membership Services Other Total Revenues Kitchener Good Life Club-Selected Revenues and Expenses Expenses Sales wages and commissions Service wages and commissions Service and other Total Direct Expenses Manager controlled Administrative Total Expenses Members Total Revenue ($) June 30 '99 Month (%) 89.9 9.3 1.8 100.0 Case 28: GoodLife Fitness Clubs 10.5 9.0 19.4 38.9 9.2 31.8 79.9 2.200 120,000 June 30 '99 YTD (12 months) (%) 88.2 10.2 1.6 100.0 12.1 7.1 28.6 47.8 15.6 31.1 94.4 1,004,000 Includes personal training, specialty programs, tanning and pro shop - Related to new membership sales Includes personal training and member services Includes service staff wages and expenses Includes utilities, supplies and services March 31 '00 Month (%) 86.9 11.9 1.2 100.0 8.3 5.3 20.4 34.0 4.8 26.3 65.0 3.200 195,000 *Includes advertising, administrative management, rent, realty taxes, equipment leasing Not included are depreciation, amortization, interest, and taxes Source: GoodLife Fitness Clubs March 31 '00 YTD (9 months) (96) 83.3 15.5 1.2 100.0 327 8.9 12.3 17.1 38.3 10.4 32.6 81.3 1,177,000
Step by Step Solution
3.37 Rating (150 Votes )
There are 3 Steps involved in it
Here is a financial analysis based on the tables provided for GoodLife Gyms Membership Trends The cl... View full answer

Get step-by-step solutions from verified subject matter experts