

Question: Create a flowchart using functions that inputs ten scores and print the number of students who passed and failed. Passing is 75%. Create a flowchart
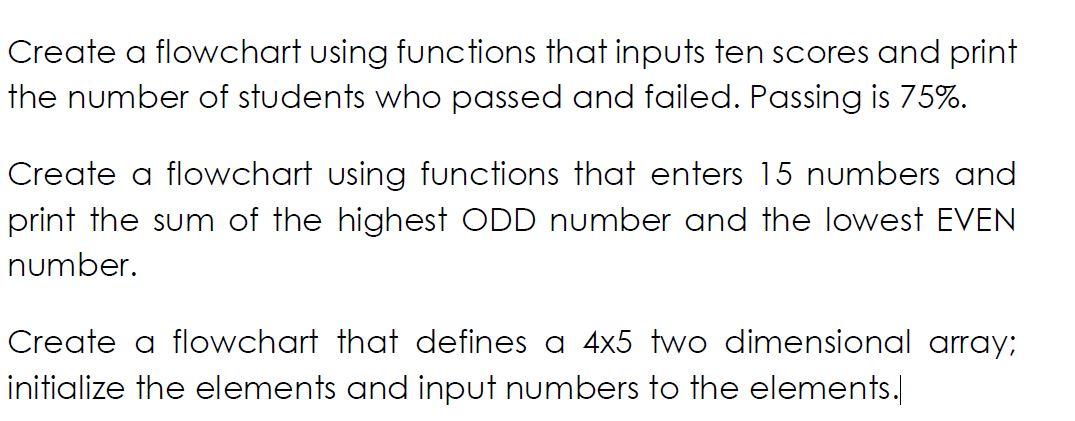
Create a flowchart using functions that inputs ten scores and print the number of students who passed and failed. Passing is 75%. Create a flowchart using functions that enters 15 numbers and print the sum of the highest ODD number and the lowest EVEN number. Create a flowchart that defines a 4x5 two dimensional array; initialize the elements and input numbers to the elements
Step by Step Solution
There are 3 Steps involved in it
1 Expert Approved Answer
Step: 1 Unlock

Question Has Been Solved by an Expert!
Get step-by-step solutions from verified subject matter experts
Step: 2 Unlock
Step: 3 Unlock