

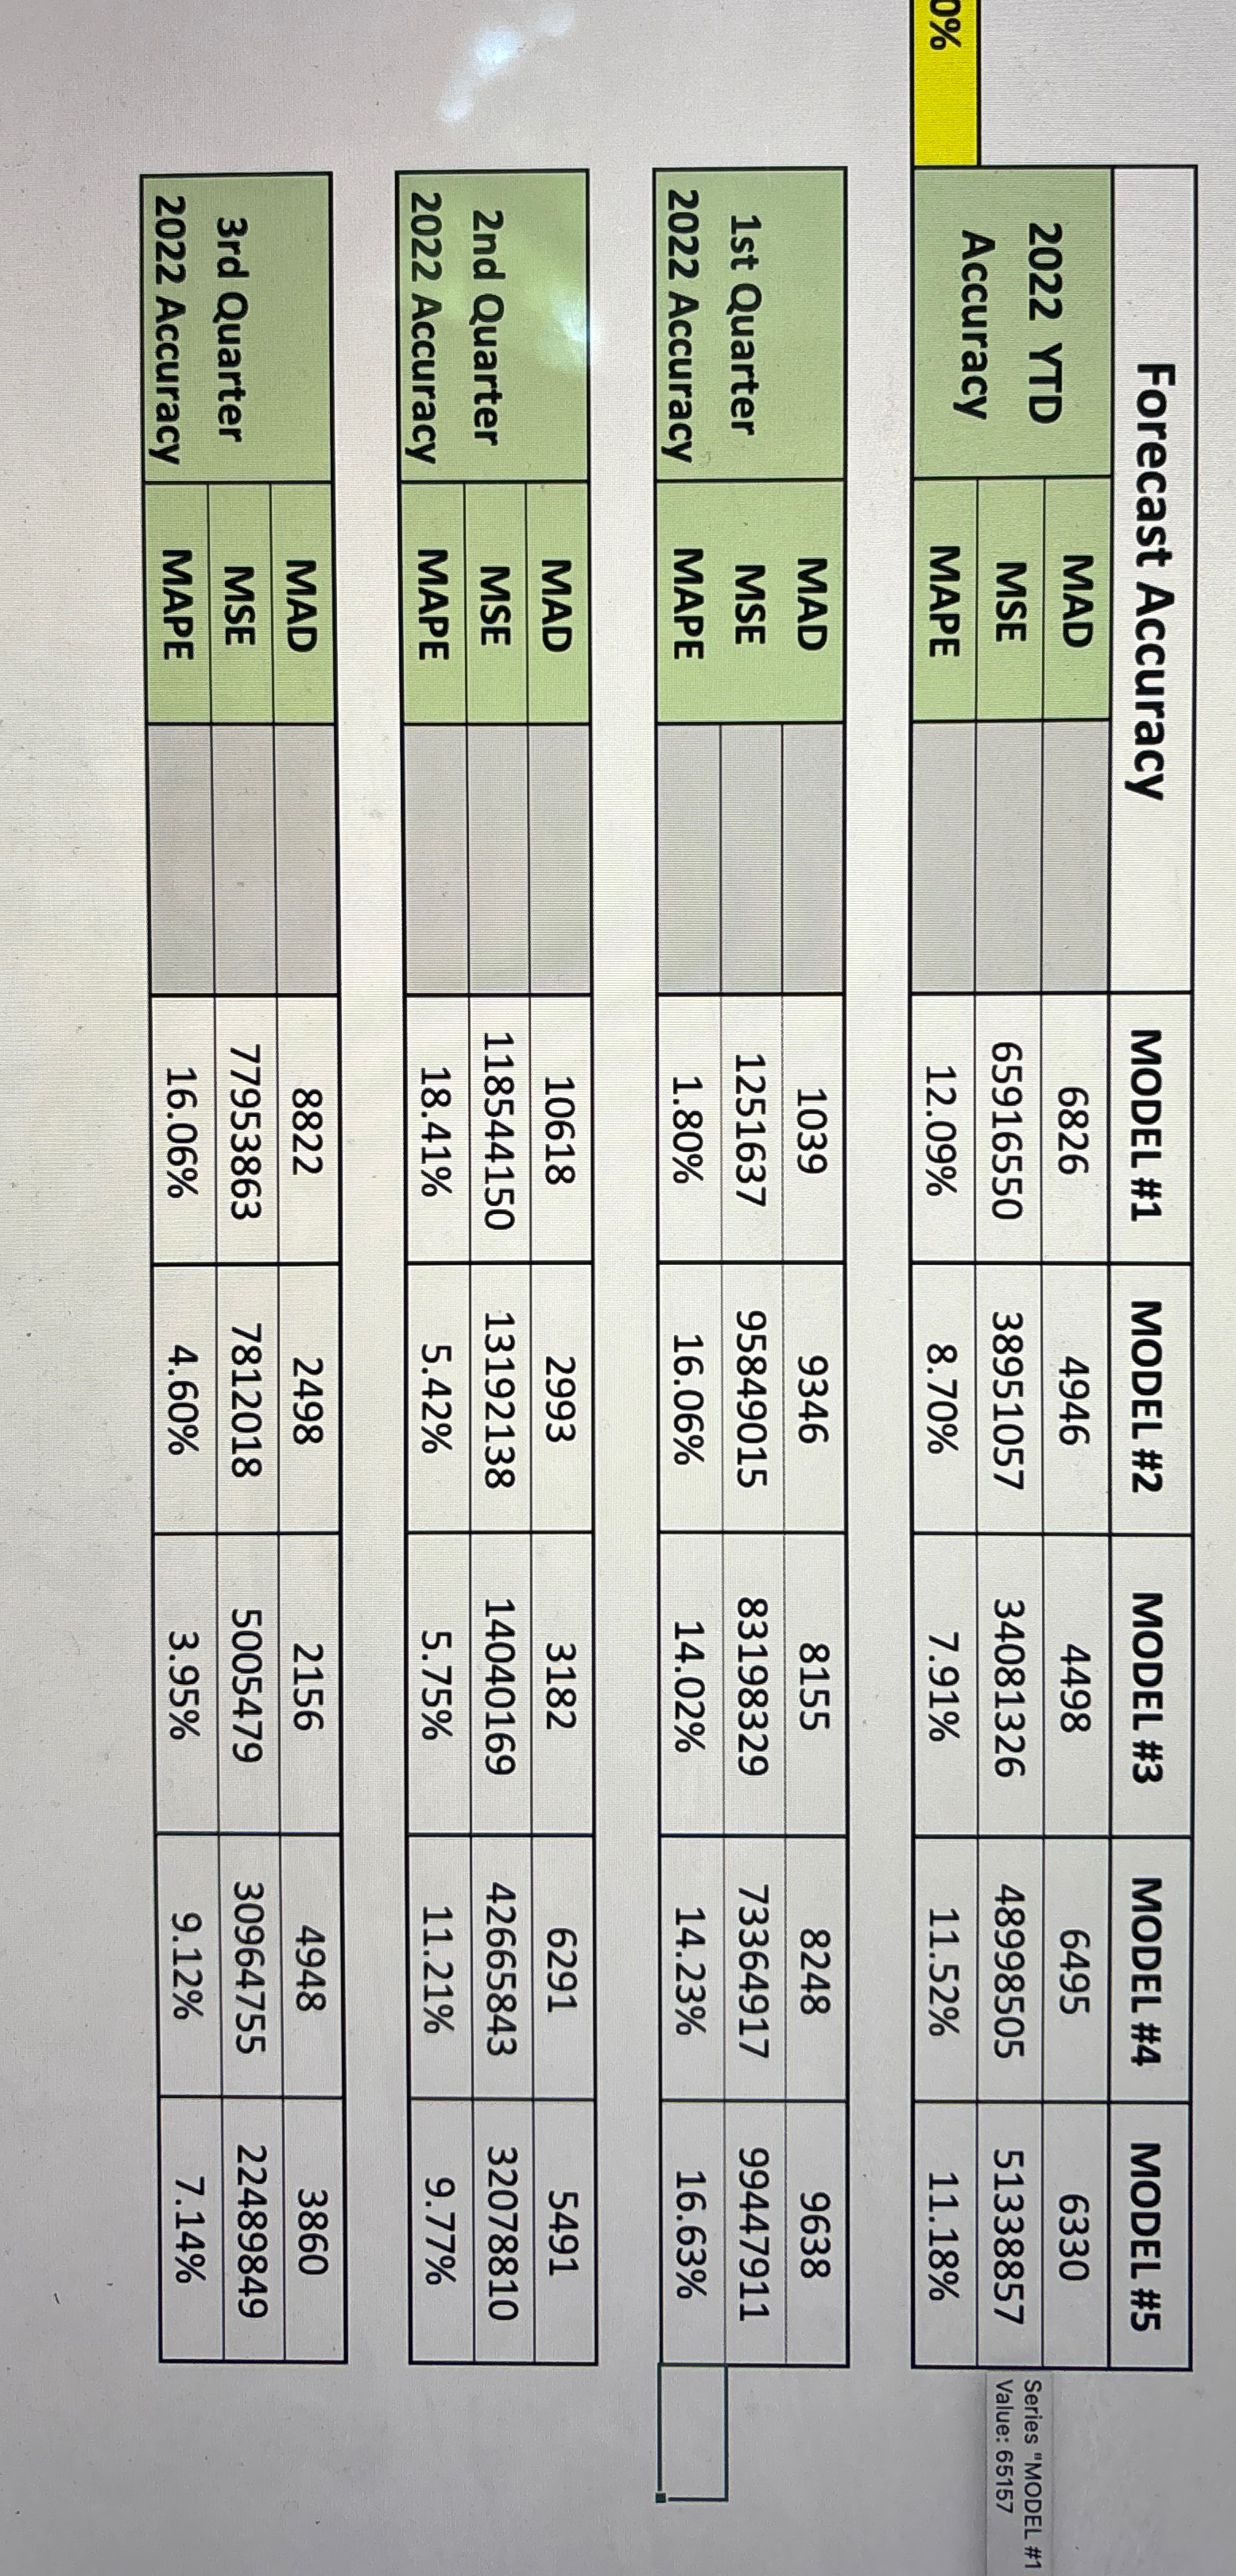
Question: Create a graph showing MAPE for all 5 forecasting models across the four specific periods, 2 0 2 2 YTD , 1 st quarter, 2
Create a graph showing MAPE for all forecasting models across the four specific periods, YTDst quarter, nd quarter, rd quarter.
Step by Step Solution
There are 3 Steps involved in it
1 Expert Approved Answer
Step: 1 Unlock

Question Has Been Solved by an Expert!
Get step-by-step solutions from verified subject matter experts
Step: 2 Unlock
Step: 3 Unlock