

Question: create a graph using this information and label x & y axis 3,29 4.70 5.16 5.37 8.60 13,20 13.40 3,40 #1 #2 #3 #4 Total
create a graph using this information and label x & y axis 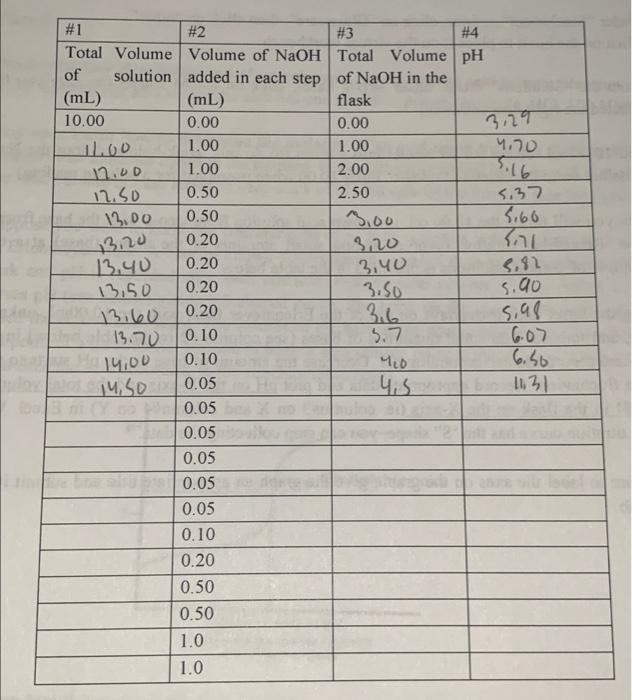
3,29 4.70 5.16 5.37 8.60 13,20 13.40 3,40 #1 #2 #3 #4 Total Volume Volume of NaOH Total Volume pH of solution added in each step of NaOH in the (mL) (mL) flask 10.00 0.00 0.00 12.00 1.00 1.00 12.0D 1.00 2.00 12.5D 0.50 2.50 13.00 0.50 3.00 0.20 3,20 0.20 13,50 0.20 3.50 0.20 3.6 13.70 0.10 H 14,00 0.10 40 14. So 0.05 45 0.05 0.05 0.05 0.05 0.05 0.10 0.20 0.50 0.50 1.0 1.0 5.92 5.90 5,98 6.07 6.50 11.31 5.7
Step by Step Solution
There are 3 Steps involved in it
1 Expert Approved Answer
Step: 1 Unlock

Question Has Been Solved by an Expert!
Get step-by-step solutions from verified subject matter experts
Step: 2 Unlock
Step: 3 Unlock