

Question: Create a histogram for the variable wait time in Excel: Review this video to learn how to create a Histogram in Excel E r Extra
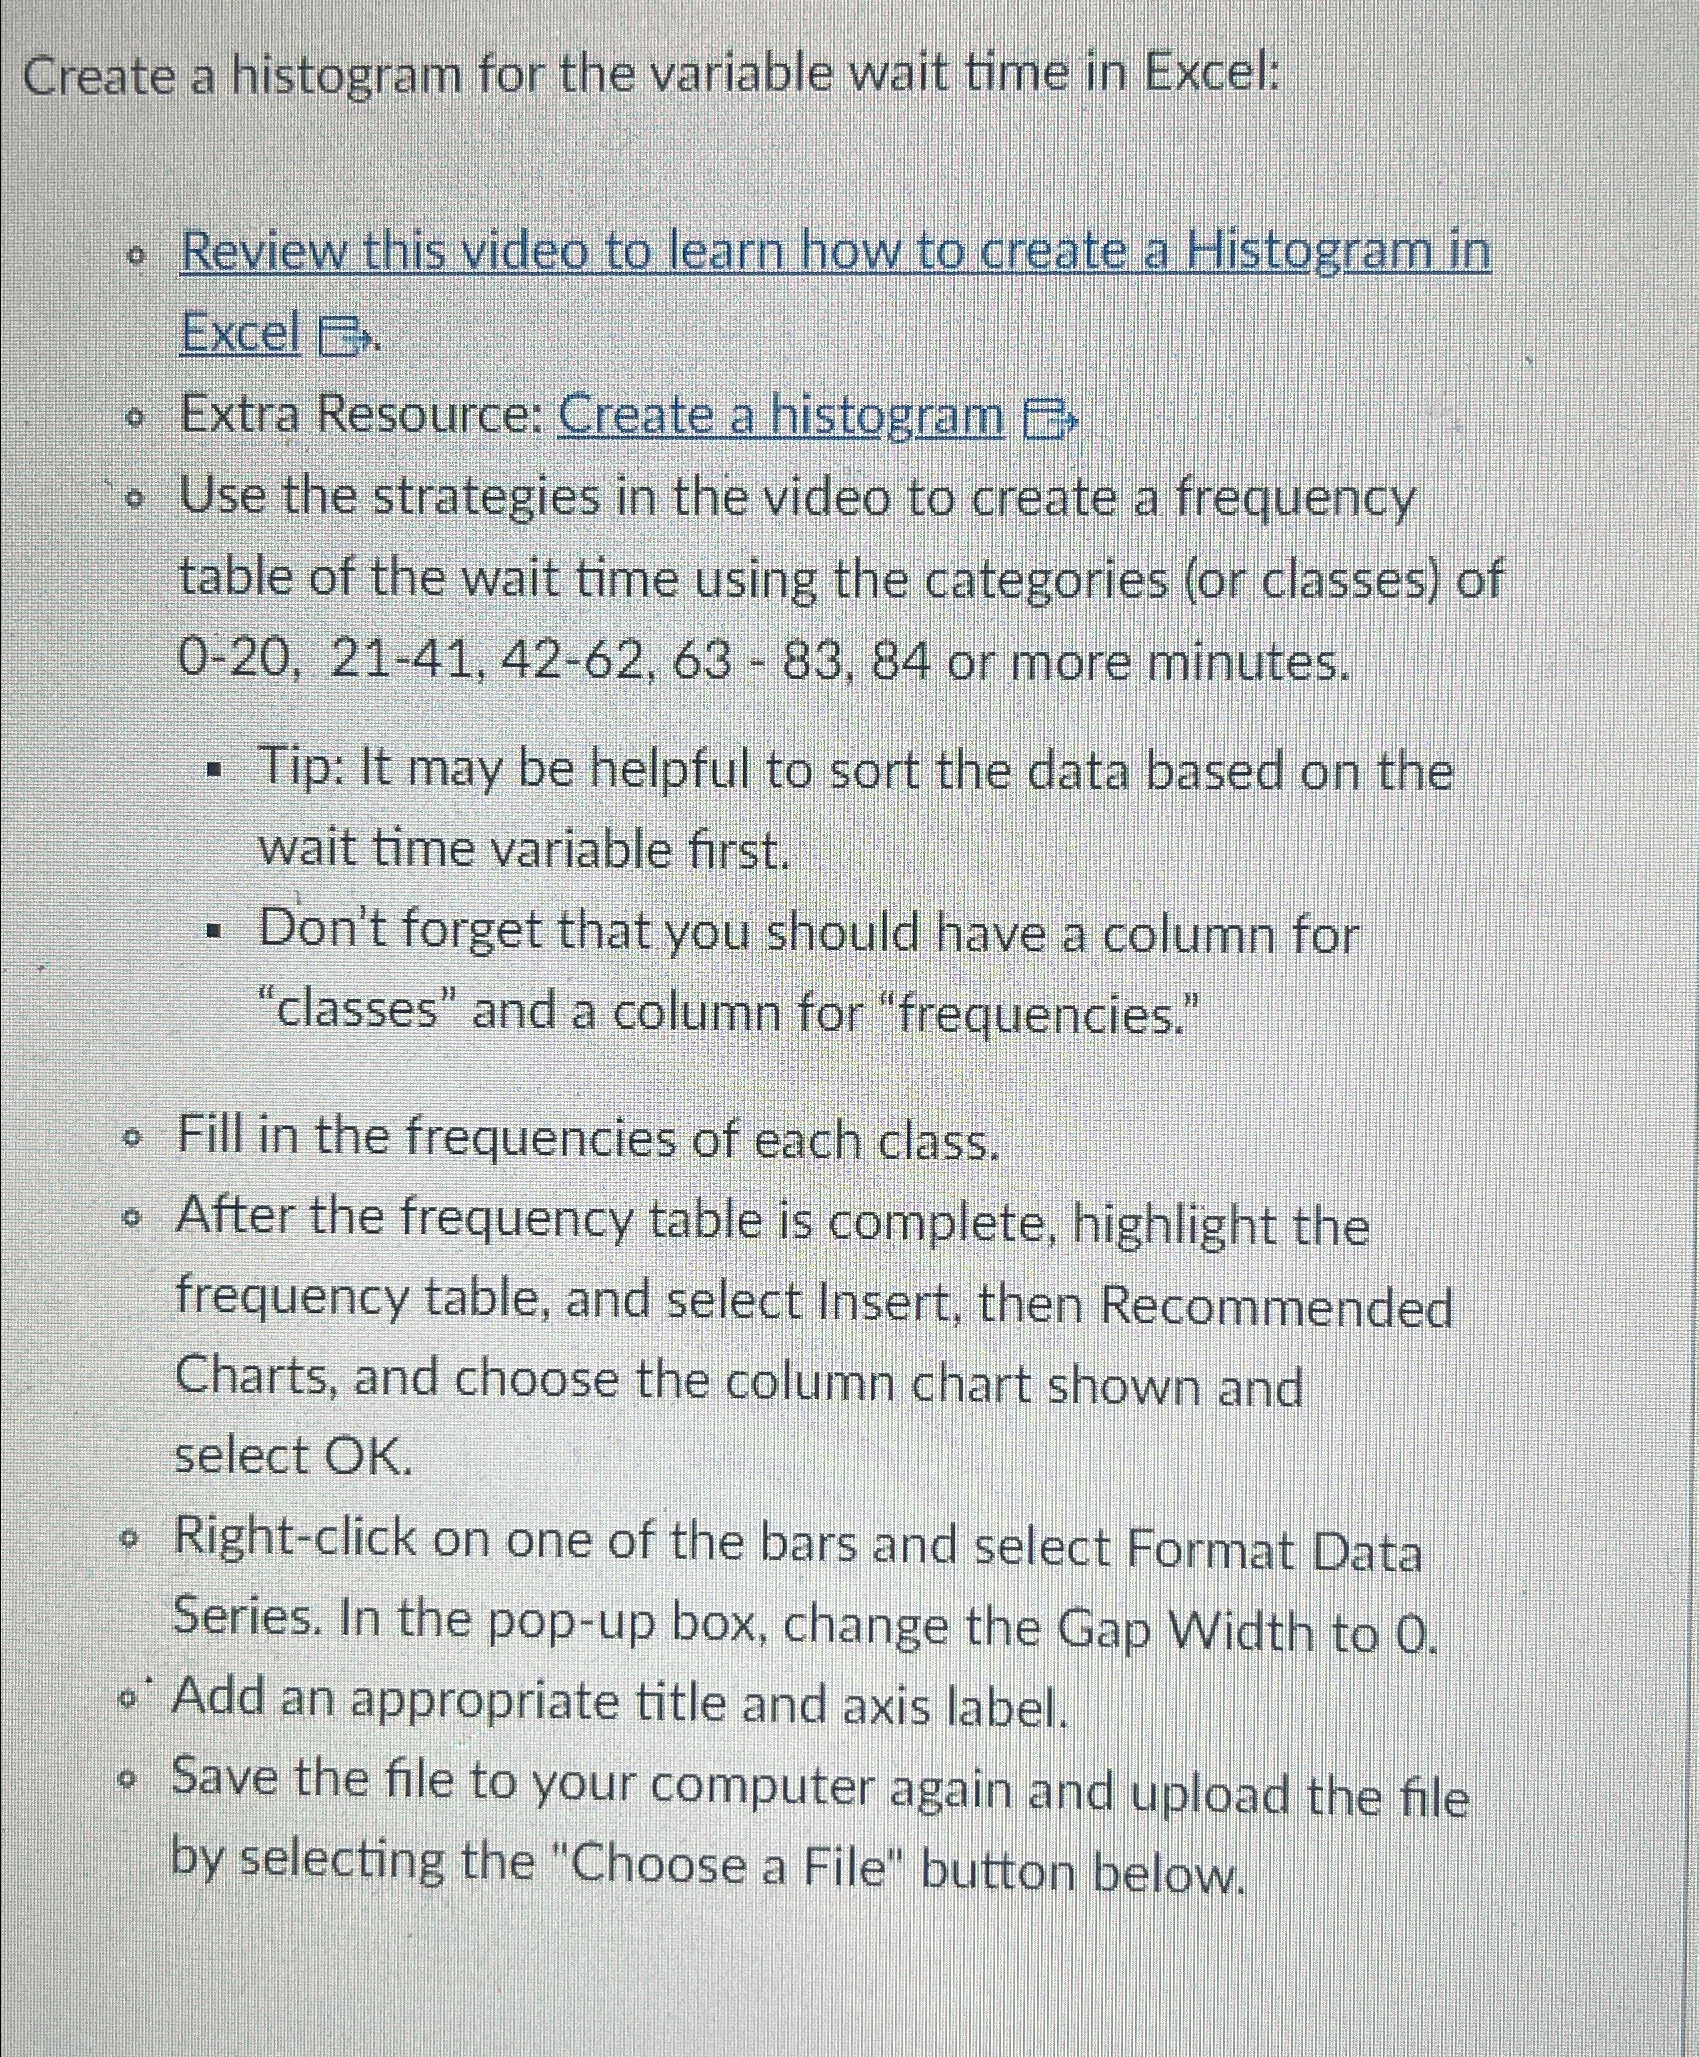
Create a histogram for the variable wait time in Excel:
Review this video to learn how to create a Histogram in Excel
Extra Resource: Create a histogram
Use the strategies in the video to create a frequency table of the wait time using the categories or classes of or more minutes.
Tip: It may be helpful to sort the data based on the wait time variable first.
Don't forget that you should have a column for "classes" and a column for "frequencies."
Fill in the frequencies of each class.
After the frequency table is complete, highlight the frequency table, and select Insert, then Recommended Charts, and choose the column chart shown and select OK
Rightclick on one of the bars and select Format Data Series. In the popup box, change the Gap Width to
@ Add an appropriate title and axis label.
Save the file to your computer again and upload the file by selecting the "Choose a File" button below.
Step by Step Solution
There are 3 Steps involved in it
1 Expert Approved Answer
Step: 1 Unlock

Question Has Been Solved by an Expert!
Get step-by-step solutions from verified subject matter experts
Step: 2 Unlock
Step: 3 Unlock