

Question: Create a line chart below that shows the four data series of SPY Close, GM Close, TSLA Close, and BTC Close. Give the chart a
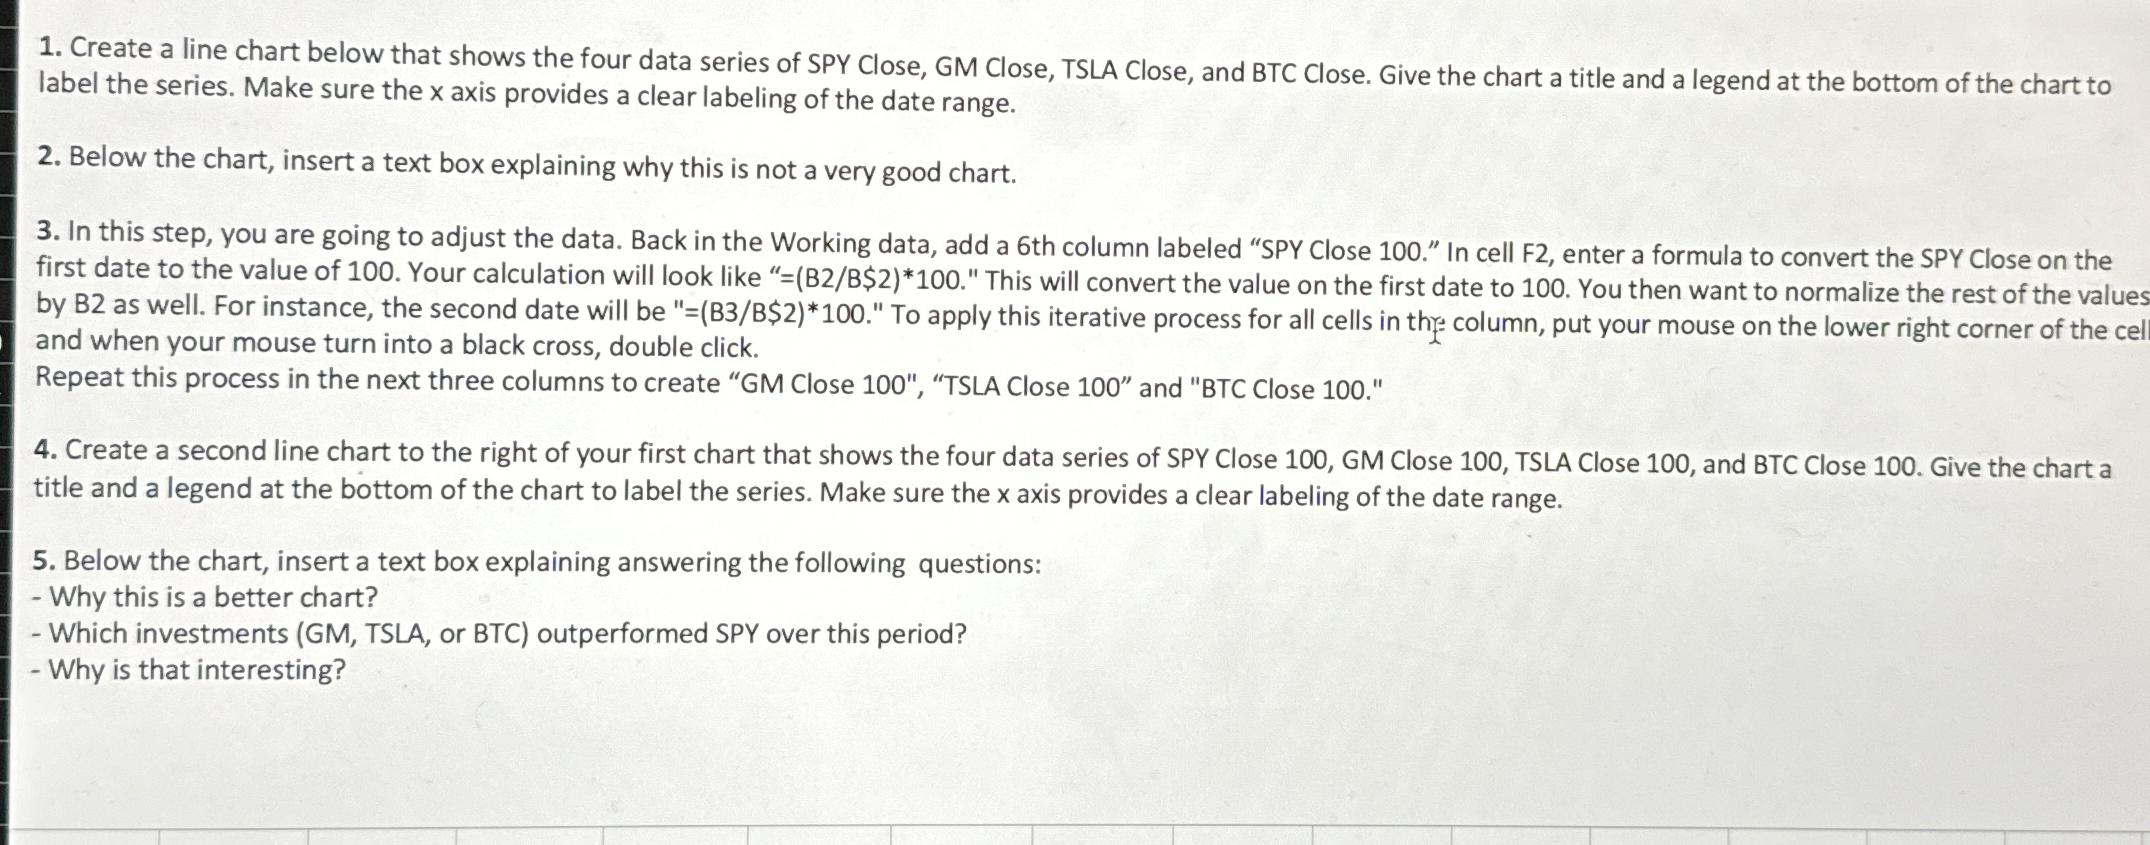
Create a line chart below that shows the four data series of SPY Close, GM Close, TSLA Close, and BTC Close. Give the chart a title and a legend at the bottom of the chart to label the series. Make sure the axis provides a clear labeling of the date range.
Below the chart, insert a text box explaining why this is not a very good chart.
In this step, you are going to adjust the data. Back in the Working data, add a th column labeled SPY Close In cell F enter a formula to convert the SPY Close on the first date to the value of Your calculation will look like $ This will convert the value on the first date to You then want to normalize the rest of the values by as well. For instance, the second date will be BB$ To apply this iterative process for all cells in thfy column, put your mouse on the lower right corner of the cel and when your mouse turn into a black cross, double click.
Repeat this process in the next three columns to create GM Close "TSLA Close and BTC Close
Create a second line chart to the right of your first chart that shows the four data series of SPY Close GM Close TSLA Close and BTC Close Give the chart a title and a legend at the bottom of the chart to label the series. Make sure the axis provides a clear labeling of the date range.
Below the chart, insert a text box explaining answering the following questions:
Why this is a better chart?
Which investments GM TSLA, or BTC outperformed SPY over this period?
Why is that interesting?
Step by Step Solution
There are 3 Steps involved in it
1 Expert Approved Answer
Step: 1 Unlock

Question Has Been Solved by an Expert!
Get step-by-step solutions from verified subject matter experts
Step: 2 Unlock
Step: 3 Unlock