

Question: This is on Excel, Note: Please specifically show or list how to do all steps correctly I am having trouble with the steps. Assignment Instructions
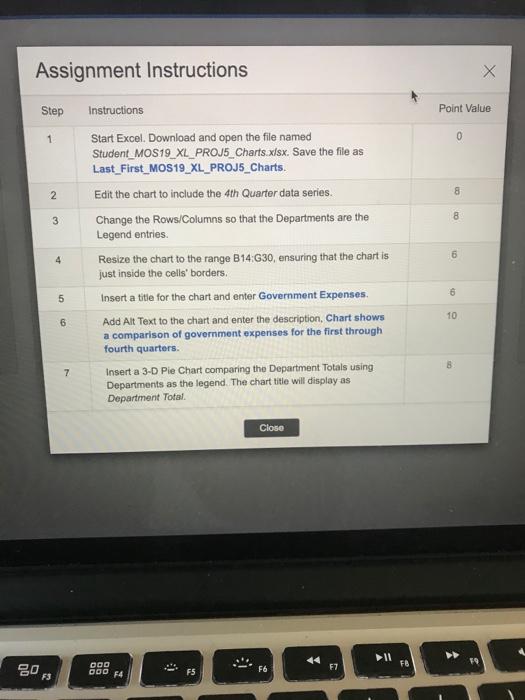
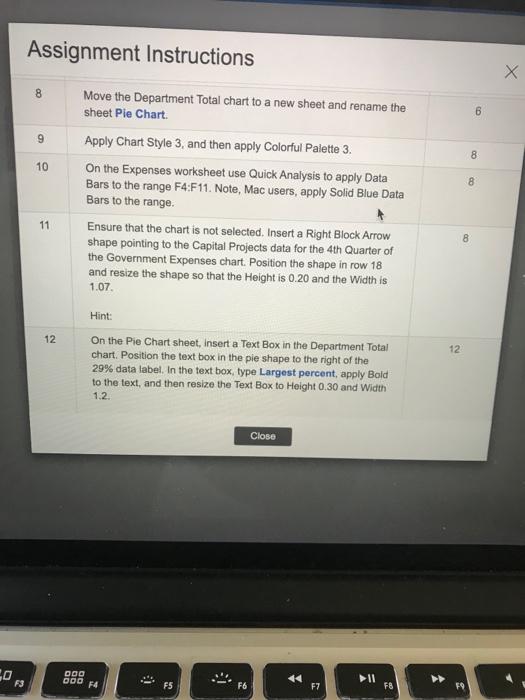
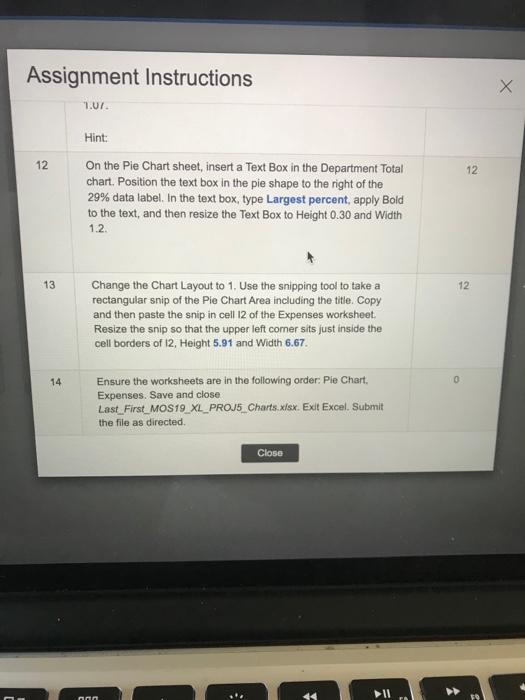
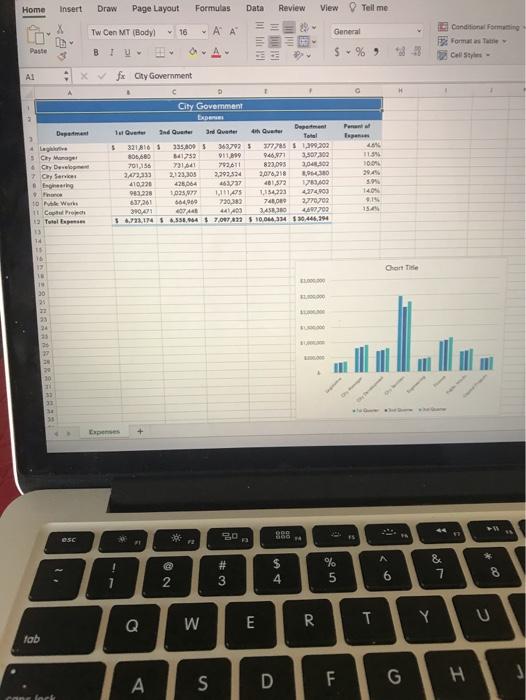
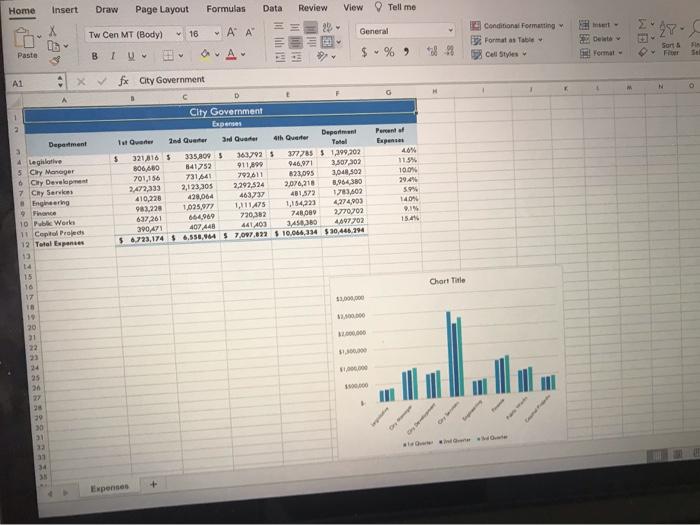
Assignment Instructions Step Point Value 1 0 2 8 8 3 Instructions Start Excel. Download and open the file named Student_MOS19_XL_PROJ5_Charts.xlsx. Save the file as Last_First_MOS19_XL_PROJS_Charts. Edit the chart to include the 4th Quarter data series Change the Rows/Columns so that the Departments are the Legend entries. Resize the chart to the range B14:30, ensuring that the chart is just inside the cells' borders. Insert a title for the chart and enter Government Expenses. Add Alt Text to the chart and enter the description, Chart shows a comparison of government expenses for the first through fourth quarters Insert a 3-D Pie Chart comparing the Department Totals using Departments as the legend. The chart title will display as Department Total 6 4 6 5 10 6 8 7 Close 000 *** 20 F7 F6 OOO 74 Assignment Instructions X 8 6 9 8 10 8 Move the Department Total chart to a new sheet and rename the sheet Pie Chart Apply Chart Style 3, and then apply Colorful Palette 3. On the Expenses worksheet use Quick Analysis to apply Data Bars to the range F4:F11. Note, Mac users, apply Solid Blue Data Bars to the range. Ensure that the chart is not selected. Insert a Right Block Arrow shape pointing to the Capital Projects data for the 4th Quarter of the Government Expenses chart. Position the shape in row 18 and resize the shape so that the height is 0.20 and the Width is 1.07 11 8 Hint: 12 12 On the Pie Chart sheet, insert a Text Box in the Department Total chart. Position the text box in the pie shape to the right of the 29% data label. In the text box, type Largest percent, apply Bold to the text, and then resize the Text Box to Height 0.30 and Width 1.2 Close 20 000 000 F4 . .. F3 II F5 F6 F7 F8 Assignment Instructions X "1.07. 12 12 Hint: On the Pie Chart sheet, insert a Text Box in the Department Total chart. Position the text box in the pie shape to the right of the 29% data label. In the text box, type Largest percent, apply Bold to the text, and then resize the Text Box to Height 0.30 and Width 1.2 13 12 Change the Chart Layout to 1. Use the snipping tool to take a rectangular snip of the Pie Chart Area including the title. Copy and then paste the snip in cell 12 of the Expenses worksheet Resize the snip so that the upper left comer sits just inside the cell borders of 12, Height 5.91 and Width 6.67. 14 0 Ensure the worksheets are in the following order: Pie Chart Expenses. Save and close Last_First_MOS19_XL_PROJ5 Charts.xlsx. Exit Excel. Submit the file as directed Close Home Insert Draw Page Layout Formulas Data Review View Tell me X Tw Cen MT (Bodyl 16 General Conditional Forming 3 Formats Tutte Call - Paste BI $ % 9 H Per Xfx ty Government C City Government Expres De Department 1 u 3rd Quarter Ind Quarter 3 4th Over Total Lagare 5 3218165 335.000 3637925 12785 $ 1.399,202 5. Chy Manager 806,680 141753 11.199 946,071 2,300,000 Chy Deo 701156 21.041 82009 3030 7 Ch Service 2,472,333 2,23,305 2,292,324 2,076,218 Engineering 410,220 983238 102 111145 1154223 4274 10 Works 7201 604 720,383 745,000 2770702 1 Capture 390,471 0744 4140 BAS, 30 27709 Total Expo 16.722.194 6.558,464 $ 700 a $10.044 314 5 10 446,294 792.011 11.3 10. 20 5. 1409 9.15 10 14 Charts TS 12 1 18 30 ... 10 11 Espenses SA 00 BO , Fa 4 2. DSC * @ # 3 $ 4 % 5 & 7 6 8 2 E T Q W R Y U Tob S D F G 3 H a foc Home Insert Draw Page Layout Formulas - Tw Cen MT (Body - A A 16 Data Review View Tell me , General % 9 WD Conditional Formatting Formats Table Cell Styles 24 Sort Paste B I AA Format A1 Xfx City Government M N H D 1 Percent of 46% Department A Leghlative 5 Clly Manager 6 Cy Development 7 Chy Services # Engineering City Government Expenses Tot Over 2nd Quarter 3rd Quarter 4th Quarter Department 5 321,8165 335.0005 3637925 377785 $ 1,399,202 806,680 841752 911.19 946971 3.507303 701,156 731.641 792611 823,095 3,048,502 2,472,333 2,123,305 2,292,524 2.076,218 3,964380 41022 28.064 463737 481.572 1783.602 982220 1,025,977 1,111 ATS 1.1542 4,274,903 637,261 664.069 720,382 748.00 2770702 390,41 407 448 441403 3.4.3 4607702 $ 23,174 $ 6.550,464 $ 7.007.822 S 10.046.334 $30,446,294 100% 29.4% 50% 14 DAL 15.45 10 Public Works 11 Copto Proges 12 Total Espances 13 Chart Title 15 16 17 300,000 0.000 21 22 23 24 25 20 27 Lali 10.00 30 31 22 31 34 Expenses
Step by Step Solution
There are 3 Steps involved in it

Get step-by-step solutions from verified subject matter experts