

Question: Create a MATLAB function: 2. Radioactive decay is an spontaneous process in which an atom loses energy and mass through the emission of radiation. In
Create a MATLAB function: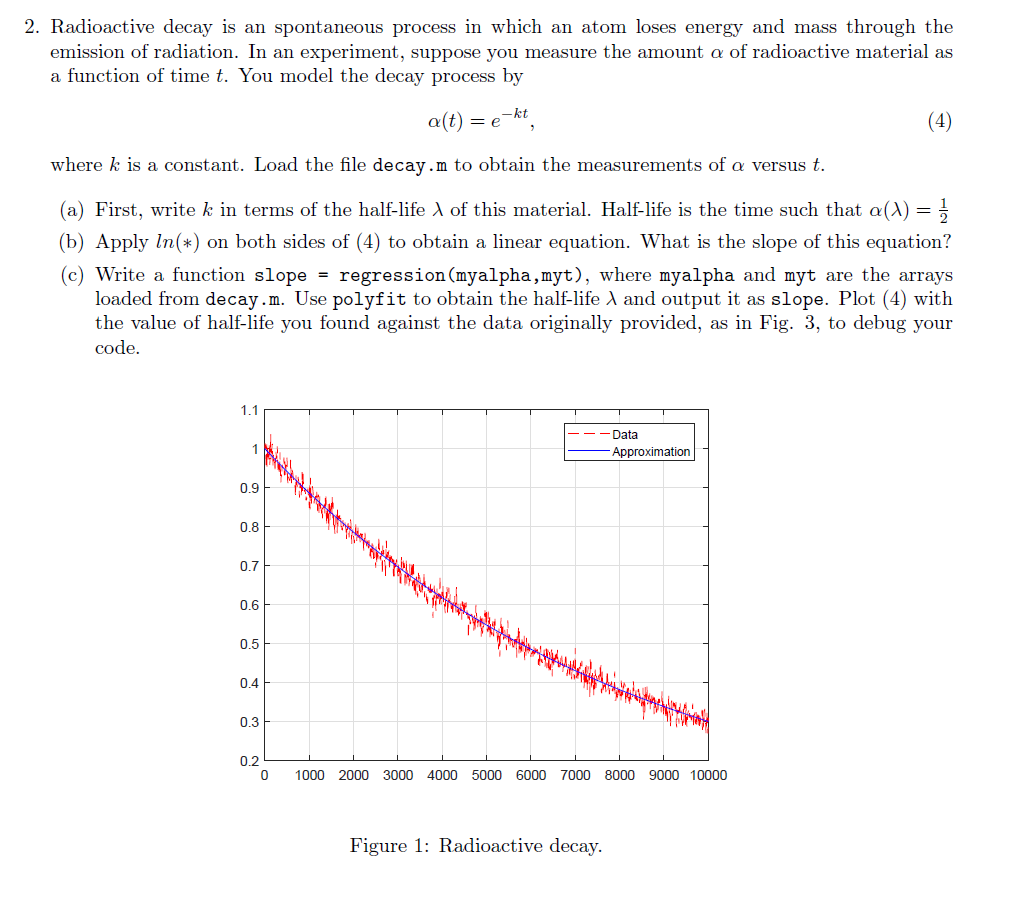
2. Radioactive decay is an spontaneous process in which an atom loses energy and mass through the emission of radiation. In an experiment, suppose you measure the amount of radioactive material as a function of time t. You model the decay process by . m to obtain the measurements of versus t. here k is a constant. Load the file decay (a) First, write k in terms of the half-life of this material. Half-life is the time such that (A) (b) Apply In() on both sides of (4) to obtain a linear equation. What is the slope of this equation? (c) Write a function slope - regression (myalpha,myt), where myalpha and myt are the arrays loaded from decay. m. Use polyfit to obtain the half-life and output it as slope. Plot (4) with the value of half-life you found against the data originally provided, as in Fig. 3, to debug your code. Data -Approximation 0.9 0.8 0.7 0.6 0.4 0.3 0.2 0 1000 2000 3000 4000 5000 6000 7000 8000 9000 10000 Figure 1: Radioactive decay 2. Radioactive decay is an spontaneous process in which an atom loses energy and mass through the emission of radiation. In an experiment, suppose you measure the amount of radioactive material as a function of time t. You model the decay process by . m to obtain the measurements of versus t. here k is a constant. Load the file decay (a) First, write k in terms of the half-life of this material. Half-life is the time such that (A) (b) Apply In() on both sides of (4) to obtain a linear equation. What is the slope of this equation? (c) Write a function slope - regression (myalpha,myt), where myalpha and myt are the arrays loaded from decay. m. Use polyfit to obtain the half-life and output it as slope. Plot (4) with the value of half-life you found against the data originally provided, as in Fig. 3, to debug your code. Data -Approximation 0.9 0.8 0.7 0.6 0.4 0.3 0.2 0 1000 2000 3000 4000 5000 6000 7000 8000 9000 10000 Figure 1: Radioactive decay
Step by Step Solution
There are 3 Steps involved in it

Get step-by-step solutions from verified subject matter experts