

Question: Create a MATLAB script file to calculate and plot the value of y for -5 5.5 using a WHILE loop. Make sure to use a
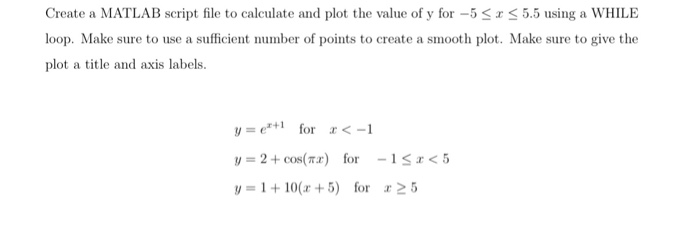
Create a MATLAB script file to calculate and plot the value of y for -5 5.5 using a WHILE loop. Make sure to use a sufficient number of points to create a smooth plot. Make sure to give the plot a title and axis labels. y=ex+1 for x
Step by Step Solution
There are 3 Steps involved in it
1 Expert Approved Answer
Step: 1 Unlock

Question Has Been Solved by an Expert!
Get step-by-step solutions from verified subject matter experts
Step: 2 Unlock
Step: 3 Unlock