

Question: Create a memo about what you found in the pivot tables and charts. Assume that the readers of the memo will be both city officials
 Create a memo about what you found in the pivot tables and charts. Assume that the readers of the memo will be both city officials who are knowledgeable about the city but not about data analytics or necessarily how to interpret data. You should make this a standalone document. That is, the person should not need to go back and forth between your memo and your analysis. You are free to copy any information you wish from your analysis to make this possible.
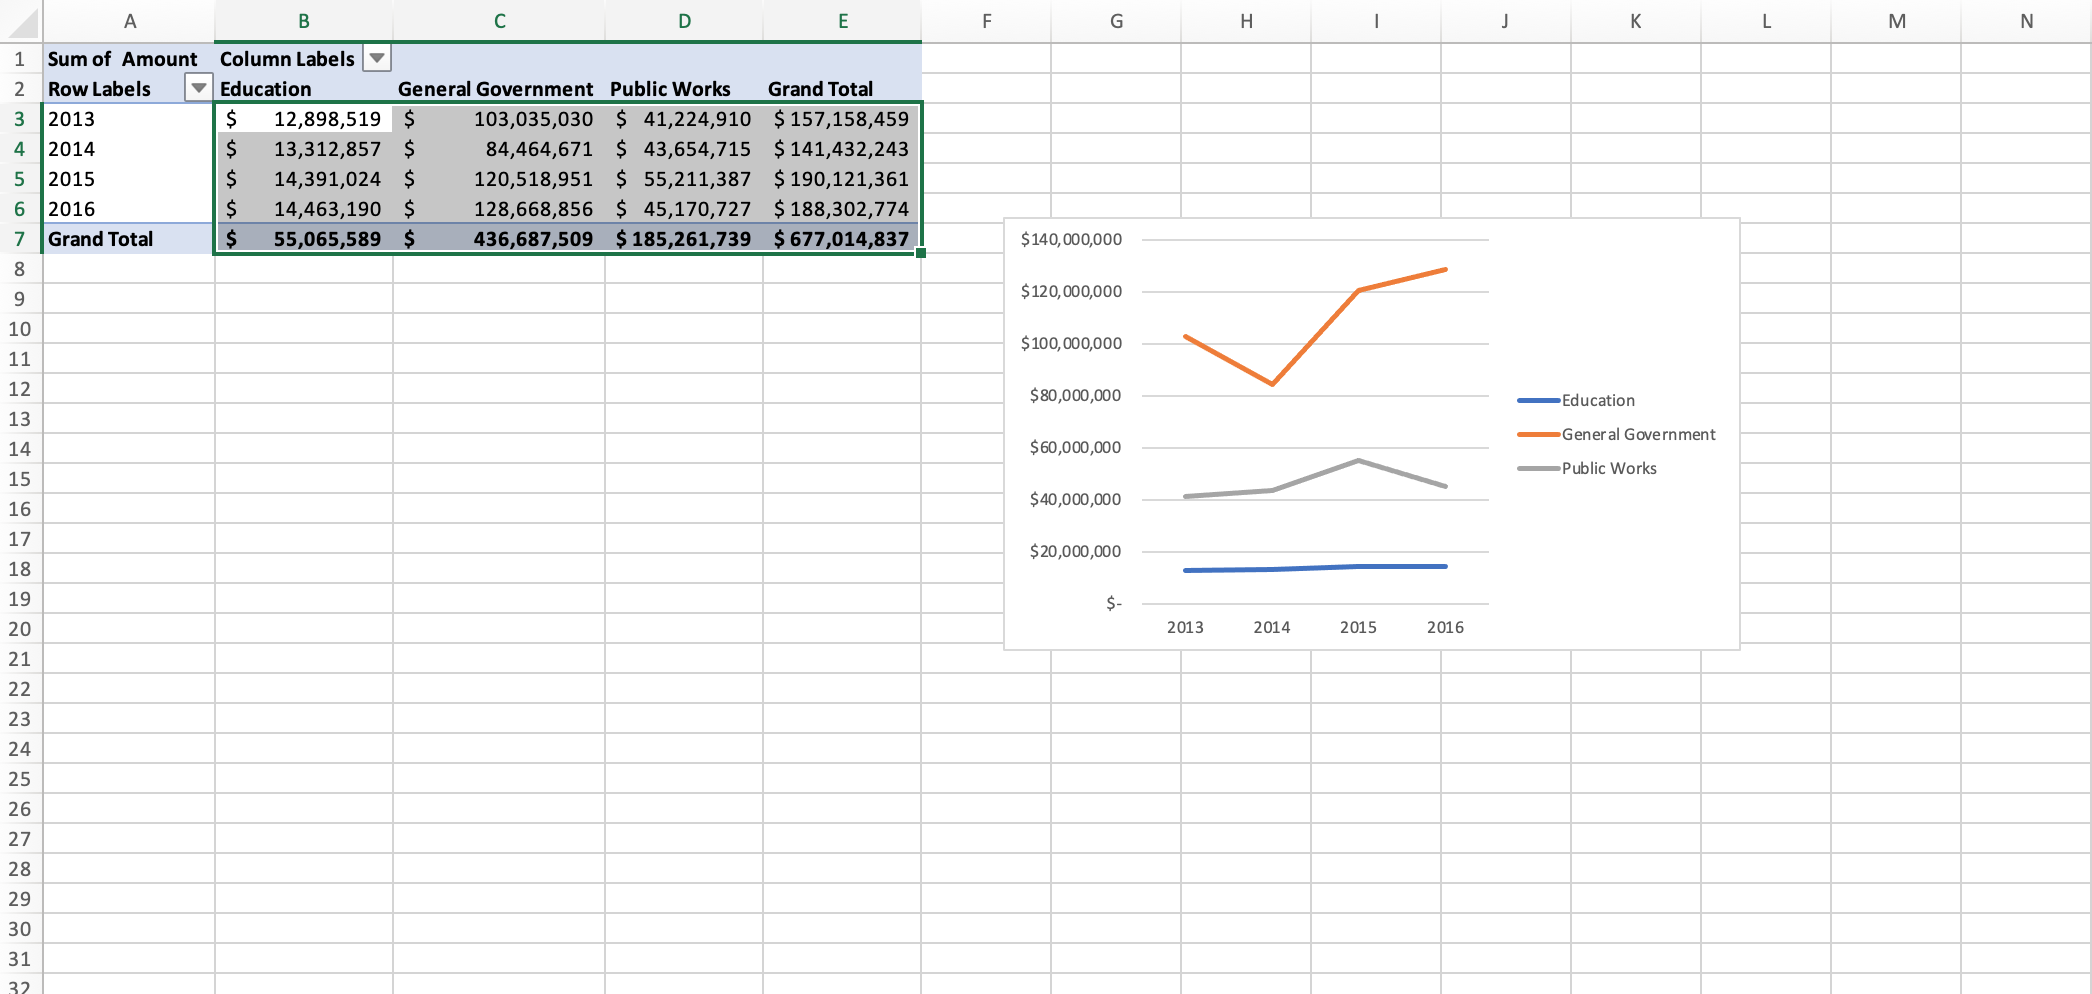
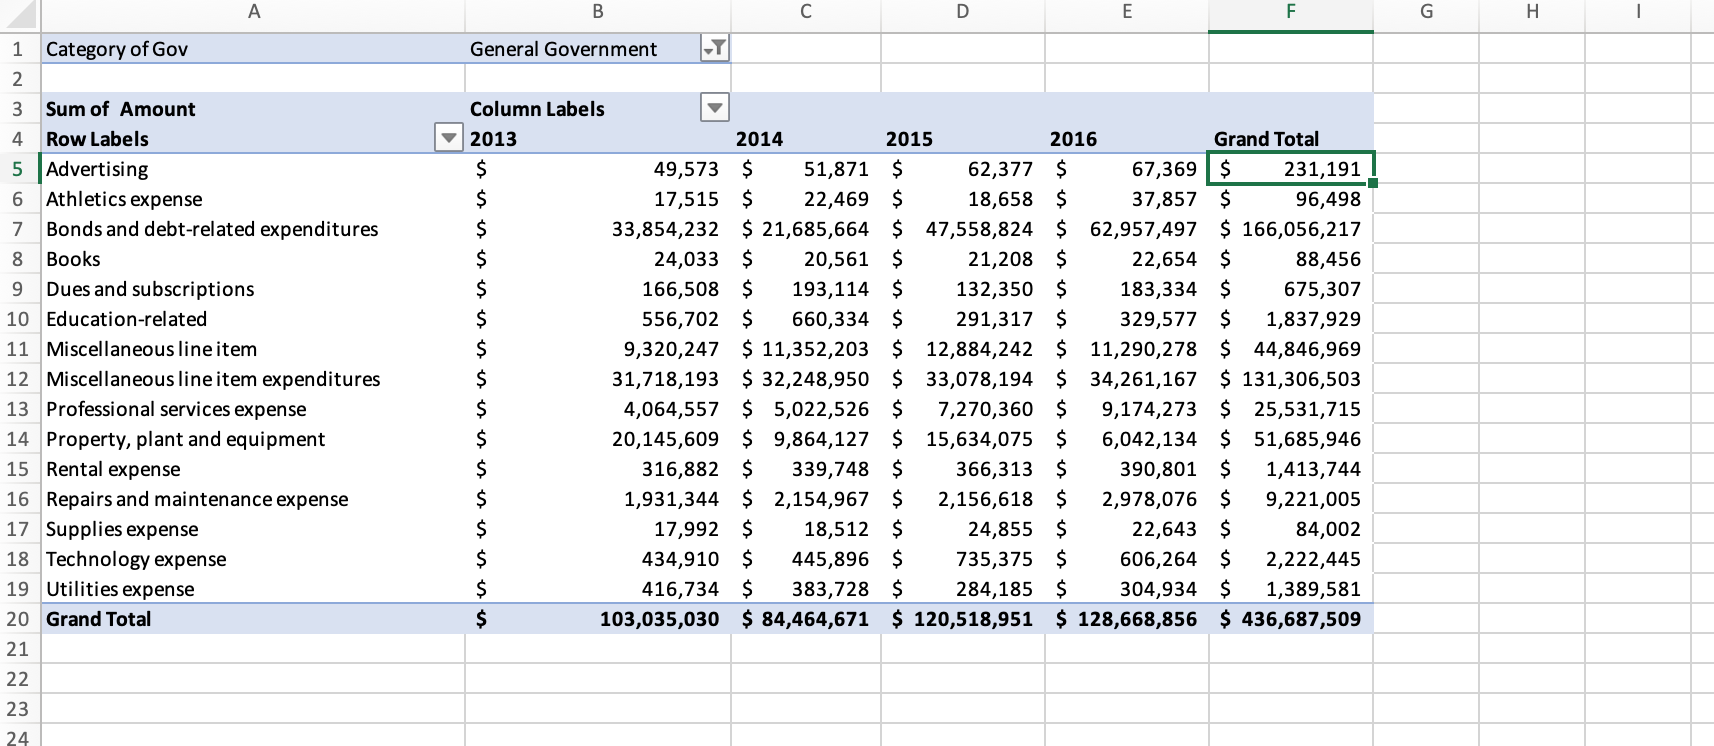
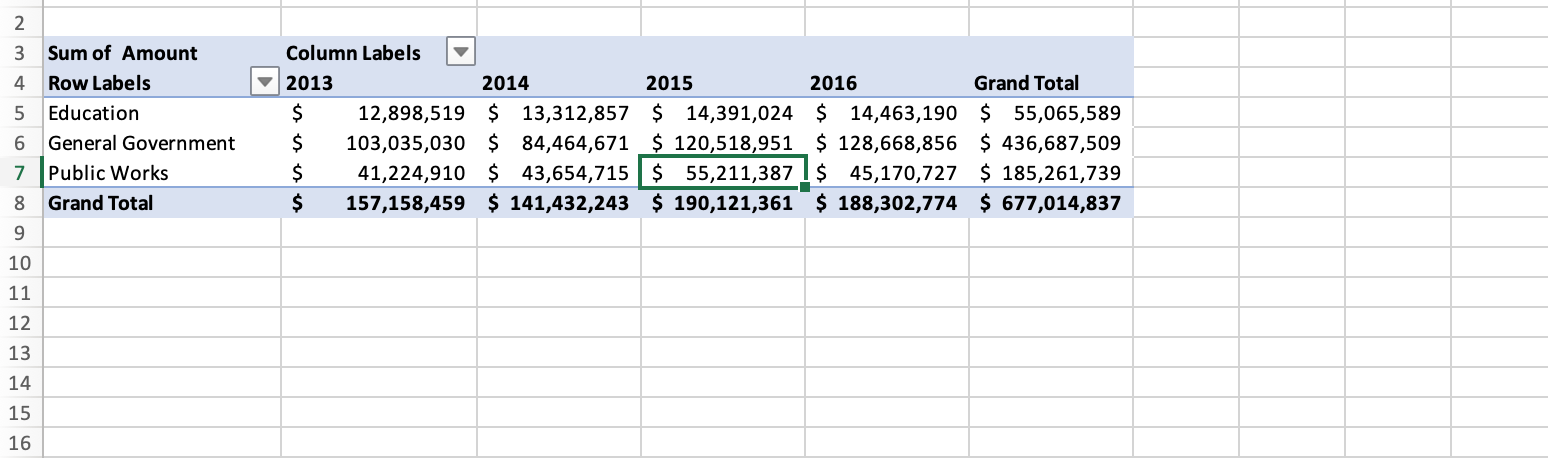
2 3 Sum of Amount 4 Row Labels 5 Education 6 General Government 7 Public Works 8 Grand Total Column Labels 2013 2014 2015 2016 Grand Total $ 12,898,519 $ 13,312,857 $ 14,391,024 $ 14,463,190 $ 55,065,589 $ 103,035,030 $ 84,464,671 $ 120,518,951 $ 128,668,856 $ 436,687,509 $ 41,224,910 $ 43,654,715 $ 55,211,387 ! $ 45,170,727 $ 185,261,739 $ 157,158,459 $ 141,432,243 $ 190,121,361 $ 188,302,774 $ 677,014,837 9 10 11 12 13 14 15 16 B C D E F G H 1 J L 3. N 1 2 Sum of Amount Row Labels 2013 3 4 2014 5 2015 6 2016 7 Grand Total Column Labels Education General Government Public Works Grand Total $ 12,898,519 $ 103,035,030 $ 41,224,910 $ 157,158,459 $ 13,312,857 $ 84,464,671 $ 43,654,715 $ 141,432,243 $ 14,391,024 $ 120,518,951 $ 55,211,387 $ 190,121,361 $ 14,463,190 $ 128,668,856 $ 45,170,727 $ 188,302,774 $ 55,065,589 $ 436,687,509 $ 185,261,739 $ 677,014,837 $140,000,000 8 9 $120,000,000 10 $100,000,000 11 12 $80,000,000 Education 13 General Government $60,000,000 Public Works 14 15 16 17 $40,000,000 $20,000,000 18 19 $- 20 2013 2014 2015 2016 21 22 23 24 25 26 27 28 29 30 31 32 2 3 Sum of Amount 4 Row Labels 5 Education 6 General Government 7 Public Works 8 Grand Total Column Labels 2013 2014 2015 2016 Grand Total $ 12,898,519 $ 13,312,857 $ 14,391,024 $ 14,463,190 $ 55,065,589 $ 103,035,030 $ 84,464,671 $ 120,518,951 $ 128,668,856 $ 436,687,509 $ 41,224,910 $ 43,654,715 $ 55,211,387 ! $ 45,170,727 $ 185,261,739 $ 157,158,459 $ 141,432,243 $ 190,121,361 $ 188,302,774 $ 677,014,837 9 10 11 12 13 14 15 16 B C D E F G H 1 J L 3. N 1 2 Sum of Amount Row Labels 2013 3 4 2014 5 2015 6 2016 7 Grand Total Column Labels Education General Government Public Works Grand Total $ 12,898,519 $ 103,035,030 $ 41,224,910 $ 157,158,459 $ 13,312,857 $ 84,464,671 $ 43,654,715 $ 141,432,243 $ 14,391,024 $ 120,518,951 $ 55,211,387 $ 190,121,361 $ 14,463,190 $ 128,668,856 $ 45,170,727 $ 188,302,774 $ 55,065,589 $ 436,687,509 $ 185,261,739 $ 677,014,837 $140,000,000 8 9 $120,000,000 10 $100,000,000 11 12 $80,000,000 Education 13 General Government $60,000,000 Public Works 14 15 16 17 $40,000,000 $20,000,000 18 19 $- 20 2013 2014 2015 2016 21 22 23 24 25 26 27 28 29 30 31 32
Step by Step Solution
There are 3 Steps involved in it

Get step-by-step solutions from verified subject matter experts