

Question: Create a new Excel File Create a new Excel file and save the file as BIT200 Test2P1XXX where XXX represents your initials. Candy Store Master
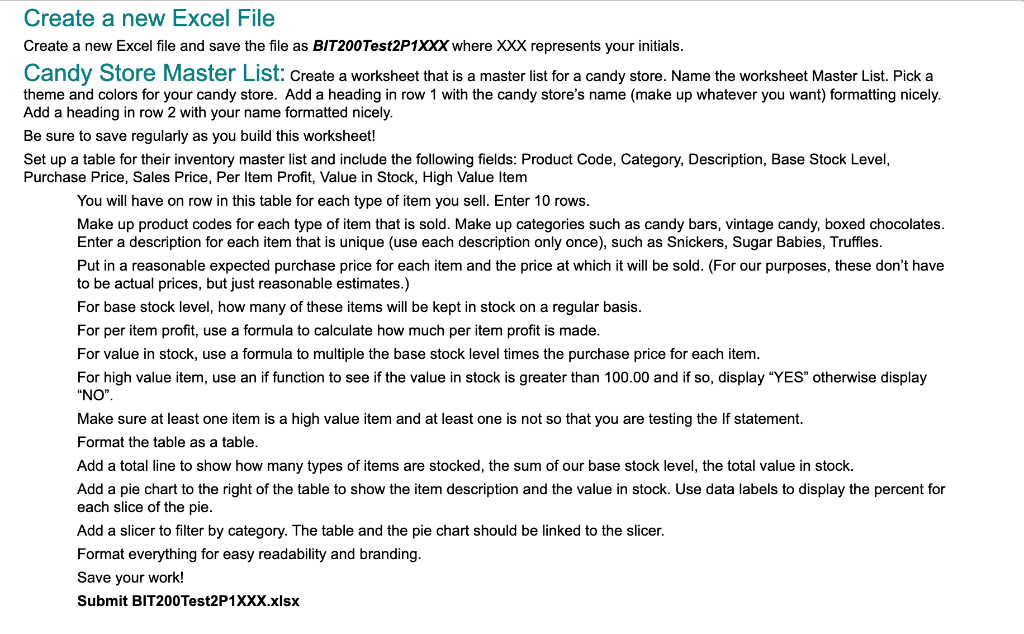
Create a new Excel File Create a new Excel file and save the file as BIT200 Test2P1XXX where XXX represents your initials. Candy Store Master List: Create a worksheet that is a master list for a candy store. Name the worksheet Master List. Pick a theme and colors for your candy store. Add a heading in row 1 with the candy store's name (make up whatever you want) formatting nicely. Add a heading in row 2 with your name formatted nicely. Be sure to save regularly as you build this worksheet! Set up a table for their inventory master list and include the following fields: Product Code, Category, Description, Base Stock Level, Purchase Price, Sales Price, Per Item Profit, Value in Stock, High Value Item You will have on row in this table for each type of item you sell. Enter 10 rows. Make up product codes for each type of item that is sold. Make up categories such as candy bars, vintage candy, boxed chocolates. Enter a description for each item that is unique (use each description only once), such as Snickers, Sugar Babies, Truffles. Put in a reasonable expected purchase price for each item and the price at which it will be sold. (For our purposes, these don't have to be actual prices, but just reasonable estimates.) For base stock level, how many of these items will be kept in stock on a regular basis. For per item profit, use a formula to calculate how much per item profit is made. For value in stock, use a formula to multiple the base stock level times the purchase price for each item. For high value item, use an if function to see if the value in stock is greater than 100.00 and if so, display "YES" otherwise display "NO". Make sure at least one item is a high value item and at least one is not so that you are testing the If statement. Format the table as a table. Add a total line to show how many types of items are stocked, the sum of our base stock level, the total value in stock. Add a pie chart to the right of the table to show the item description and the value in stock. Use data labels to display the percent for each slice of the pie. Add a slicer to filter by category. The table and the pie chart should be linked to the slicer. Format everything for easy readability and branding. Save your work! Submit BIT200 Test2P1XXX.xlsx Create a new Excel File Create a new Excel file and save the file as BIT200 Test2P1XXX where XXX represents your initials. Candy Store Master List: Create a worksheet that is a master list for a candy store. Name the worksheet Master List. Pick a theme and colors for your candy store. Add a heading in row 1 with the candy store's name (make up whatever you want) formatting nicely. Add a heading in row 2 with your name formatted nicely. Be sure to save regularly as you build this worksheet! Set up a table for their inventory master list and include the following fields: Product Code, Category, Description, Base Stock Level, Purchase Price, Sales Price, Per Item Profit, Value in Stock, High Value Item You will have on row in this table for each type of item you sell. Enter 10 rows. Make up product codes for each type of item that is sold. Make up categories such as candy bars, vintage candy, boxed chocolates. Enter a description for each item that is unique (use each description only once), such as Snickers, Sugar Babies, Truffles. Put in a reasonable expected purchase price for each item and the price at which it will be sold. (For our purposes, these don't have to be actual prices, but just reasonable estimates.) For base stock level, how many of these items will be kept in stock on a regular basis. For per item profit, use a formula to calculate how much per item profit is made. For value in stock, use a formula to multiple the base stock level times the purchase price for each item. For high value item, use an if function to see if the value in stock is greater than 100.00 and if so, display "YES" otherwise display "NO". Make sure at least one item is a high value item and at least one is not so that you are testing the If statement. Format the table as a table. Add a total line to show how many types of items are stocked, the sum of our base stock level, the total value in stock. Add a pie chart to the right of the table to show the item description and the value in stock. Use data labels to display the percent for each slice of the pie. Add a slicer to filter by category. The table and the pie chart should be linked to the slicer. Format everything for easy readability and branding. Save your work! Submit BIT200 Test2P1XXX.xlsx
Step by Step Solution
There are 3 Steps involved in it

Get step-by-step solutions from verified subject matter experts