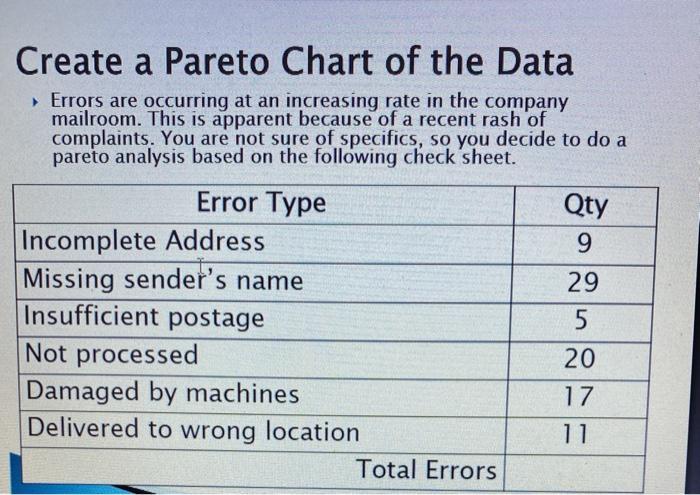
Question: Create a Pareto Chart of the Data Errors are occurring at an increasing rate in the company mailroom. This is apparent because of a recent

Create a Pareto Chart of the Data Errors are
Create a Pareto Chart of the Data Errors are occurring at an increasing rate in the company mailroom. This is apparent because of a recent rash of complaints. You are not sure of specifics, so you decide to do a pareto analysis based on the following check sheet. Qty 9 29 Error Type Incomplete Address Missing sender's name Insufficient postage Not processed Damaged by machines Delivered to wrong location Total Errors 5 20 17 11 Specification of part produced at Dave's Metal Fabricators: Day 01-Nov-14 02-Nov-14 03-Nov-14 04-Nov-14 05-Nov-14 06-Nov-14 07-Nov-14 08-Nov-14 09-Nov-14 10-Nov-14 11-Nov-14 12-Nov-14 Measurement 60 66 75 89 92 70 65 52 41 25 69 72 Control Chart Example Do the following: 1. Determine average of the data 2. Determine average moving range of the data 3. Plot the data points on a time plot/run chart 4. Draw a line representing the average 5. Calculate and add the Upper and Lower control limits 6. Add the following customer specifications Upper Spec = 70 Lower Spec 50

Step by Step Solution

There are 3 Steps involved in it

1 Expert Approved Answer
Step: 1 Unlock blur-text-image
Question Has Been Solved by an Expert!

Get step-by-step solutions from verified subject matter experts

Step: 2 Unlock
Step: 3 Unlock

Students Have Also Explored These Related General Management Questions!