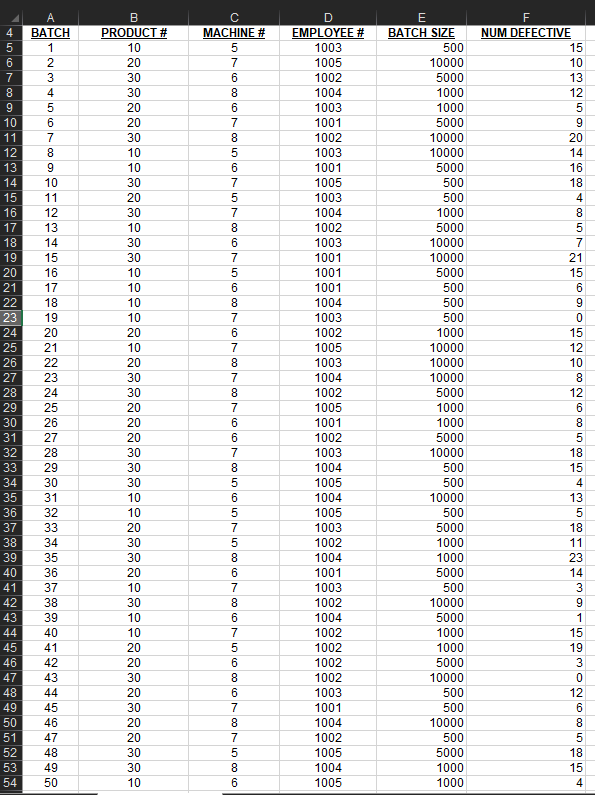
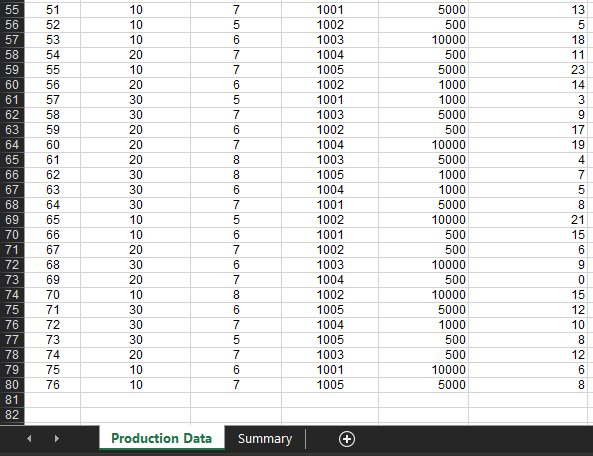
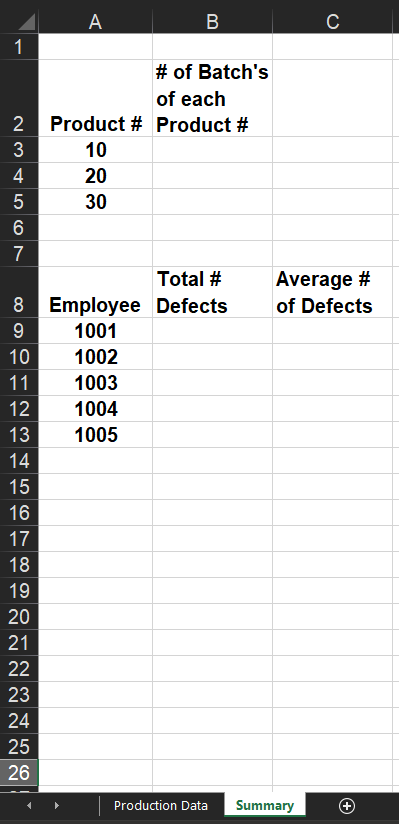
Question: Create a Pivot table showing Product # by the Sum of Num Defective Create a Pivot table showing Machine # by the Average of Num

  1. Create a Pivot table showing Product # by the Sum of Num Defective
  2. Create a Pivot table showing Machine # by the Average of Num Defective
  3. Create a Pivot table showing Employee # by the Average of Num Defective

Create a Pivot table showing Product # by the SumCreate a Pivot table showing Product # by the Sum

Create a Pivot table showing Product # by the Sum

4 5 6 7 8 9 10 11 12 13 14 15 B PRODUCT # 10 20 30 30 20 20 30 10 10 30 20 30 10 F. NUM DEFECTIVE 15 10 13 12 5 9 20 14 16 18 4 8 5 7 21 15 6 9 0 15 12 16 30 30 10 10 10 10 20 10 20 BATCH 1 2 3 4 5 6 7 8 9 10 11 12 13 14 15 16 17 18 19 20 21 22 23 24 25 26 27 28 29 30 31 32 33 34 35 36 37 38 39 40 41 42 43 44 45 46 47 48 49 50 17 18 19 20 21 22 23 24 25 26 27 28 29 30 31 32 33 34 35 36 37 38 39 40 41 42 43 30 30 20 MACHINE # 5 7 6 8 6 7 8 5 6 7 5 7 8 6 7 5 6 8 7 6 7 8 7 8 7 6 6 7 8 5 6 5 7 5 8 6 7 8 6 7 5 6 8 6 7 8 7 5 8 6 D EMPLOYEE # 1003 1005 1002 1004 1003 1001 1002 1003 1001 1005 1003 1004 1002 1003 1001 1001 1001 1004 1003 1002 1005 1003 1004 1002 1005 1001 1002 1003 1004 1005 1004 1005 1003 1002 1004 1001 1003 1002 1004 1002 1002 1002 1002 1003 1001 1004 1002 1005 1004 1005 E BATCH SIZE 500 10000 5000 1000 1000 5000 10000 10000 5000 500 500 1000 5000 10000 10000 5000 500 500 500 1000 10000 10000 10000 5000 1000 1000 5000 10000 500 500 10000 500 5000 1000 1000 5000 500 10000 5000 1000 1000 5000 10000 500 500 10000 500 5000 1000 1000 20 20 30 30 30 10 10 20 30 30 8 12 6 8 5 18 15 4 13 5 18 11 23 14 3 9 1 15 19 3 20 10 30 10 10 20 44 20 30 12 45 46 47 48 49 50 51 52 53 54 20 30 20 20 30 30 10 51 52 55 56 57 58 59 60 61 62 63 64 65 66 67 68 69 70 71 72 73 74 75 76 77 78 79 80 81 82 53 54 55 56 57 58 59 60 61 62 63 64 65 66 67 68 69 70 71 72 73 10 10 10 20 10 20 30 30 20 20 20 30 30 30 10 10 20 30 20 10 30 30 30 20 10 10 7 5 6 7 7 6 5 7 6 7 8 8 6 7 5 6 7 6 7 8 6 1001 1002 1003 1004 1005 1002 1001 1003 1002 1004 1003 1005 1004 1001 1002 1001 1002 1003 1004 1002 1005 1004 1005 1003 1001 1005 5000 500 10000 500 5000 1000 1000 5000 500 10000 5000 1000 1000 5000 10000 500 500 10000 500 10000 5000 1000 500 500 10000 5000 13 5 18 11 23 14 3 9 17 19 4 7 5 8 21 15 6 9 0 74 75 76 Production Data Summary D B C 1 # of Batch's of each 2 Product # Product # 3 10 4 20 5 30 6 7 Total # Average # 8 Employee Defects of Defects 9 1001 10 1002 11 1003 12 1004 13 1005 14 15 16 17 18 19 20 21 22 23 24 25 26 Production Data Summary 4 5 6 7 8 9 10 11 12 13 14 15 B PRODUCT # 10 20 30 30 20 20 30 10 10 30 20 30 10 F. NUM DEFECTIVE 15 10 13 12 5 9 20 14 16 18 4 8 5 7 21 15 6 9 0 15 12 16 30 30 10 10 10 10 20 10 20 BATCH 1 2 3 4 5 6 7 8 9 10 11 12 13 14 15 16 17 18 19 20 21 22 23 24 25 26 27 28 29 30 31 32 33 34 35 36 37 38 39 40 41 42 43 44 45 46 47 48 49 50 17 18 19 20 21 22 23 24 25 26 27 28 29 30 31 32 33 34 35 36 37 38 39 40 41 42 43 30 30 20 MACHINE # 5 7 6 8 6 7 8 5 6 7 5 7 8 6 7 5 6 8 7 6 7 8 7 8 7 6 6 7 8 5 6 5 7 5 8 6 7 8 6 7 5 6 8 6 7 8 7 5 8 6 D EMPLOYEE # 1003 1005 1002 1004 1003 1001 1002 1003 1001 1005 1003 1004 1002 1003 1001 1001 1001 1004 1003 1002 1005 1003 1004 1002 1005 1001 1002 1003 1004 1005 1004 1005 1003 1002 1004 1001 1003 1002 1004 1002 1002 1002 1002 1003 1001 1004 1002 1005 1004 1005 E BATCH SIZE 500 10000 5000 1000 1000 5000 10000 10000 5000 500 500 1000 5000 10000 10000 5000 500 500 500 1000 10000 10000 10000 5000 1000 1000 5000 10000 500 500 10000 500 5000 1000 1000 5000 500 10000 5000 1000 1000 5000 10000 500 500 10000 500 5000 1000 1000 20 20 30 30 30 10 10 20 30 30 8 12 6 8 5 18 15 4 13 5 18 11 23 14 3 9 1 15 19 3 20 10 30 10 10 20 44 20 30 12 45 46 47 48 49 50 51 52 53 54 20 30 20 20 30 30 10 51 52 55 56 57 58 59 60 61 62 63 64 65 66 67 68 69 70 71 72 73 74 75 76 77 78 79 80 81 82 53 54 55 56 57 58 59 60 61 62 63 64 65 66 67 68 69 70 71 72 73 10 10 10 20 10 20 30 30 20 20 20 30 30 30 10 10 20 30 20 10 30 30 30 20 10 10 7 5 6 7 7 6 5 7 6 7 8 8 6 7 5 6 7 6 7 8 6 1001 1002 1003 1004 1005 1002 1001 1003 1002 1004 1003 1005 1004 1001 1002 1001 1002 1003 1004 1002 1005 1004 1005 1003 1001 1005 5000 500 10000 500 5000 1000 1000 5000 500 10000 5000 1000 1000 5000 10000 500 500 10000 500 10000 5000 1000 500 500 10000 5000 13 5 18 11 23 14 3 9 17 19 4 7 5 8 21 15 6 9 0 74 75 76 Production Data Summary D B C 1 # of Batch's of each 2 Product # Product # 3 10 4 20 5 30 6 7 Total # Average # 8 Employee Defects of Defects 9 1001 10 1002 11 1003 12 1004 13 1005 14 15 16 17 18 19 20 21 22 23 24 25 26 Production Data Summary

Step by Step Solution

There are 3 Steps involved in it

1 Expert Approved Answer
Step: 1 Unlock blur-text-image
Question Has Been Solved by an Expert!

Get step-by-step solutions from verified subject matter experts

Step: 2 Unlock
Step: 3 Unlock

Students Have Also Explored These Related General Management Questions!